Tuesday, October 31, 2006

Another one bites the dust? 7043 Liav Avenue

This townhouse was sold on May 17, 2005 as new construction for $845,000. Today on the way home from work I noticed the "For Sale By Owner" yardarm and being the bubble-crazed blogger that I am, I immediately drove around the corner to White Circle to park the car and walked back up this road with my camera to take the picture. Asking price is now $899,000. Is the first buyer in trouble after 17 months?

You can be a housing bubble blogger too!

A number of people have been emailing me and asking me about trends in specific areas, and although I sincerely wish I had the time to cover more areas, I just can't do it. Los Angeles County housing bubble watchers can certainly use more regional bloggers! Anybody out there willing to step up to the plate?!? Are you committed? Will you be able to blog through sun and snow and sleet and hail?

In the hopes of inspiring more of you to blog about your local housing bubbles, I thought I would post on what tools I use to track housing market trends in my area.

The #1 tool is your two legs. Walk around your neighborhood and start collecting real estate brochures. Did you know we've been doing this since we moved to Redondo Beach from Gardena in 1995? Yes, believe it. We thought the market was "a tad pricey" then, well - you know what I think of it now!

But don't do what I did - just throw those real estate flyers in a file drawer. Take them home and write the date on them - then throw them in the file drawer. If you want to set up your own database of market trends, the properties on these flyers will make useful records. In the meantime they give you great anecdotal evidence of what's going on.

And no, it's not too late to get started. We have years of excess to work off.

Take that stack of flyers out occasionally and then look up the addresses on domania.com and see if anything has sold. If it hasn't sold, go to ziprealty.com and see if the asking price has come down. If so, note the new asking price on the flyer. If the property has sold, note the sales price and date on the flyer. If you don't want to go the database route, you can just blog that real estate transaction, if you think it's worth blogging. Include your own photograph.

And this leads to the #2 tool - a camera. A picture is worth 1000 words. This year I purchased a Casio Excelim with one of the purposes being blogging work. It's very slim and fits in the back pocket of my jeans. Keep your camera with you at all times.

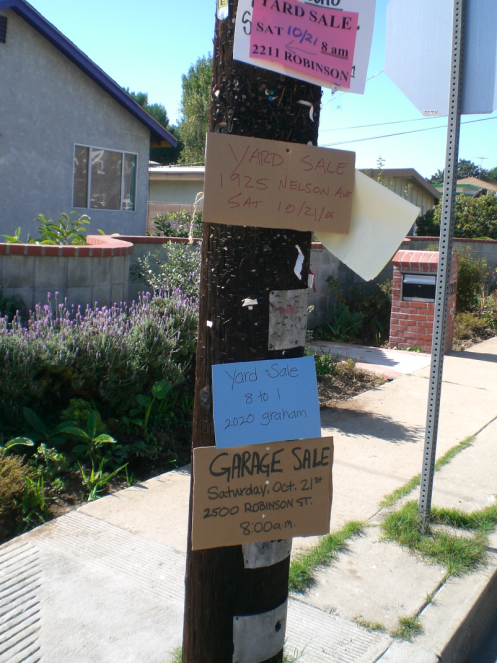
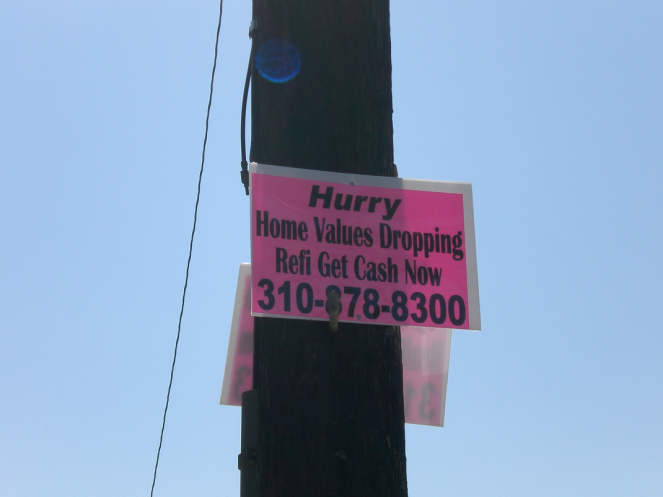
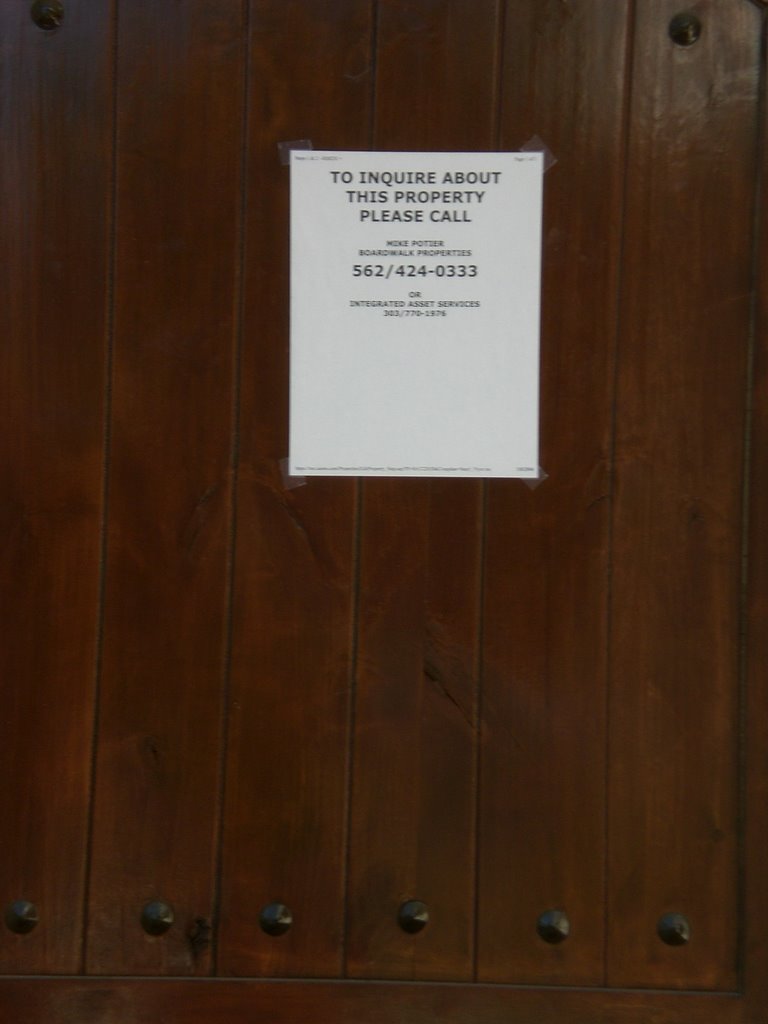
I don't normally find the best situations to photograph while I'm walking around looking for them. Rather, I wait for the situations to come to me. When you see something great, photograph it ASAP. Last weekend I photographed a sign in my neighborhood saying home values were dropping. I'm glad I jumped on it because that sign disappeared a few days later. One time I photographed construction in Playa Vista, off the Santa Monica #3 bus. Organize your photographs on your computer in folders labeled by date, so you have a proper timeline.

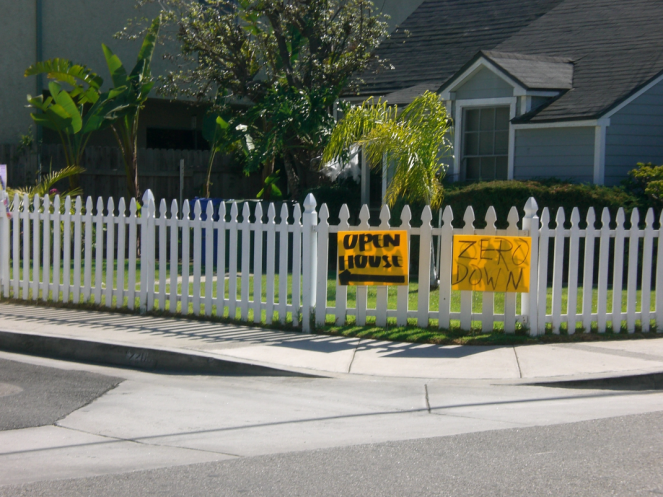
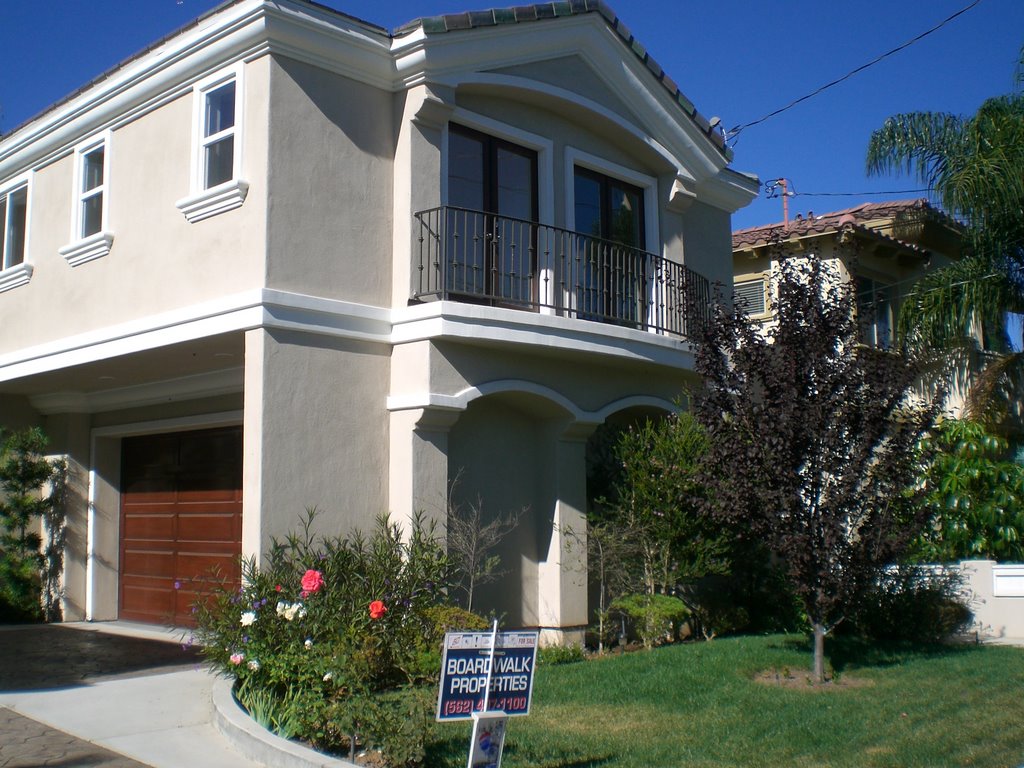
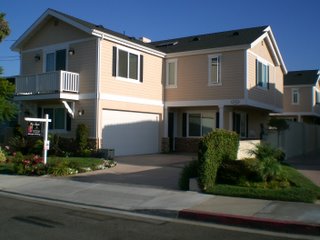
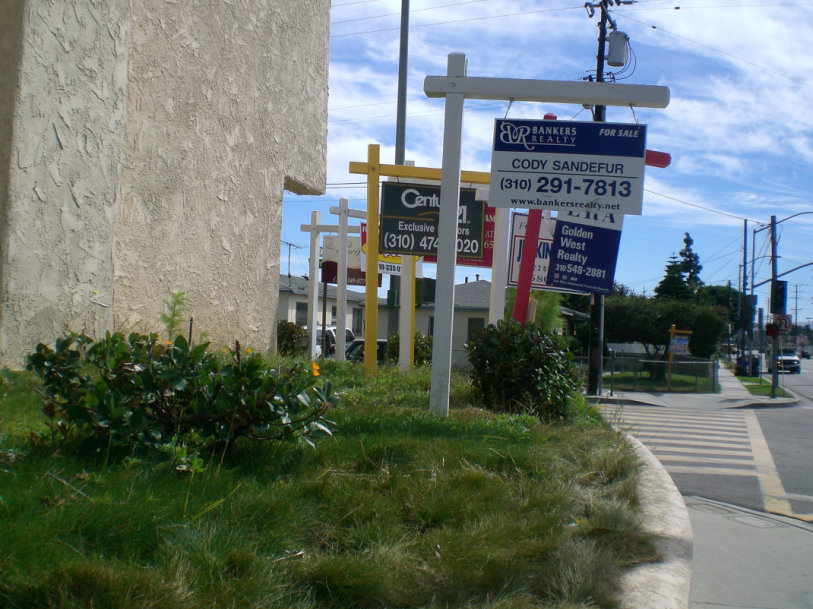
There are all kinds of things you might be able to photograph. Dilapidated box houses with outrageous asking prices. New McMansions with out of the galaxy asking prices. Construction sites. Signs. Open house flags. Sign twirlers. A house auction. Creative new ways of advertising a house that nobody else has thought of yet.

A scanner can also come in handy. I've scanned pages out of the Learning Annex for their real estate classes, pages out of books, and snail-mailed brochures from the local high-density housing projects in the area, and I've blogged them all.

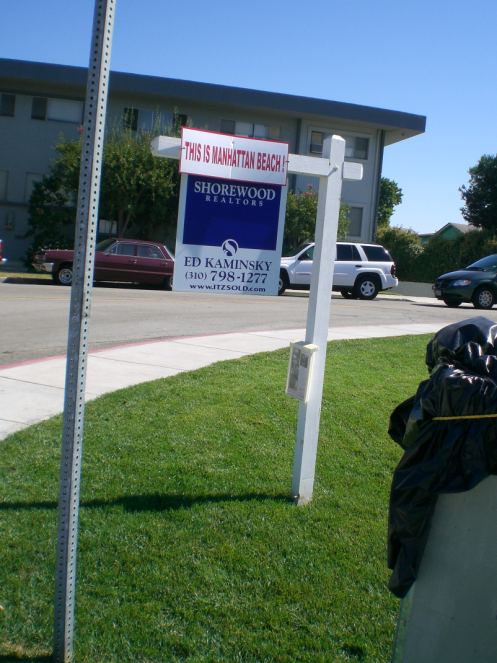
I would be careful about scanning real estate flyers to post in the blog. When I talk about or photograph specific properties, I like to obscure addresses, license plates, and the names and phone numbers of realtors on signs. I don't want anybody harassed because I posted personal identifying information on this blog.

Pick a few properties that you want to monitor and periodically publish updates on them. Have their listings expired? Have they been relisted? Have the asking prices changed? How was attendance at their open houses?

If there are papers published that are really local to your region, scan them for interesting real estate articles. Recently in my neighborhood there was an episode of Extreme Home Makeover filmed (or whatever it's called). I would have blogged it if I had the time. Almost next door to that house there is another house being remodeled with shipping containers! (That was also written up in the local papers, and I didn't have time to blog it either.) In my view that's an even more interesting story because it says something about what these homeowners value in construction. As it turned out, they were able to cut construction costs by $100 a square foot. Stories about building materials and methods and ways to cut costs for the homeowner will be of future interest, because the standard wasteful bloated construction I see now will probably disappear.

If you did all of the above and nothing else, and did it on a regular basis, you will have a great anecdotal regional housing bubble blog. It would not be a heavy-duty number crunching blog but it would still communicate a great deal. I only wish I had done these things properly starting from 11 years ago! But back then there was no domania.com, and it never dawned on me that there might one day be a way to look up real estate sales online.

If you want a heavier duty number-crunching blog, then a little tech know-how will serve you well. If you want to cover a lot of areas, then you might want to upload the charts to a website and just point the blog to that website, like I do.

To track real estate $$$ volume by zip code, I use melissadata.com, Notepad, Microsoft Excel, and PhotoImpact.

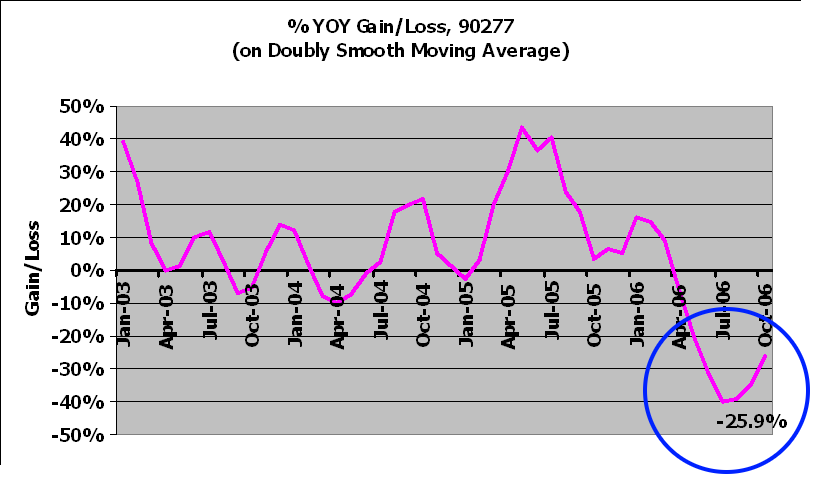
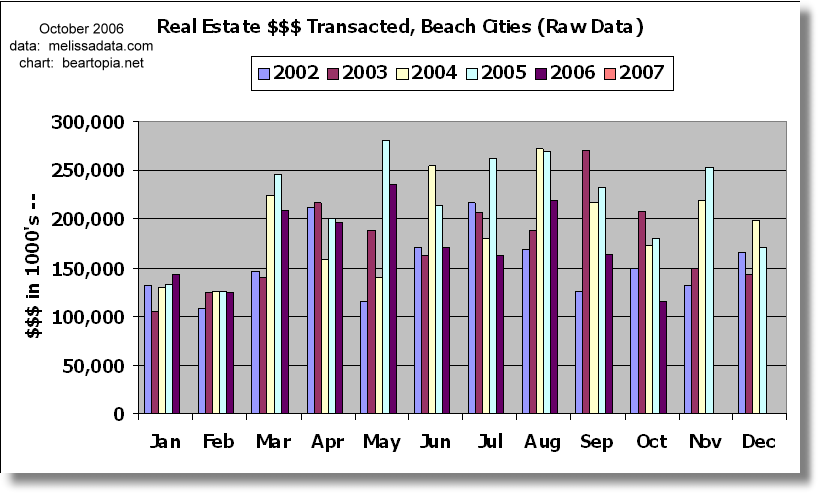
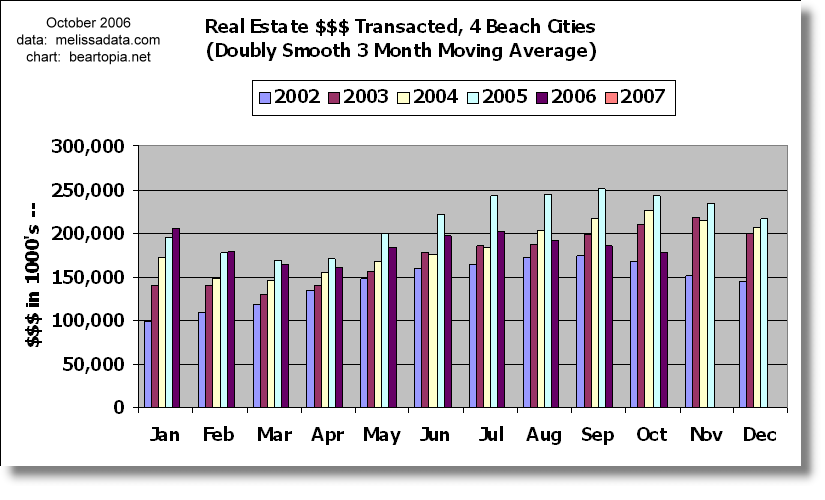
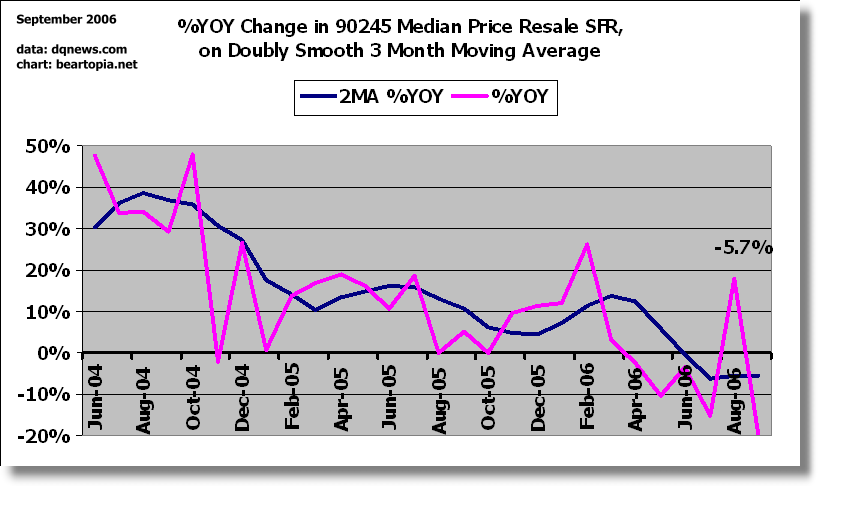
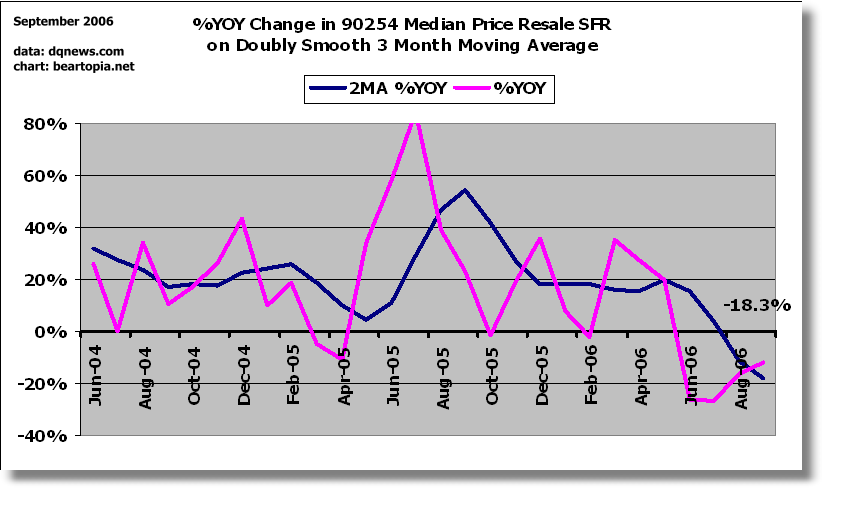
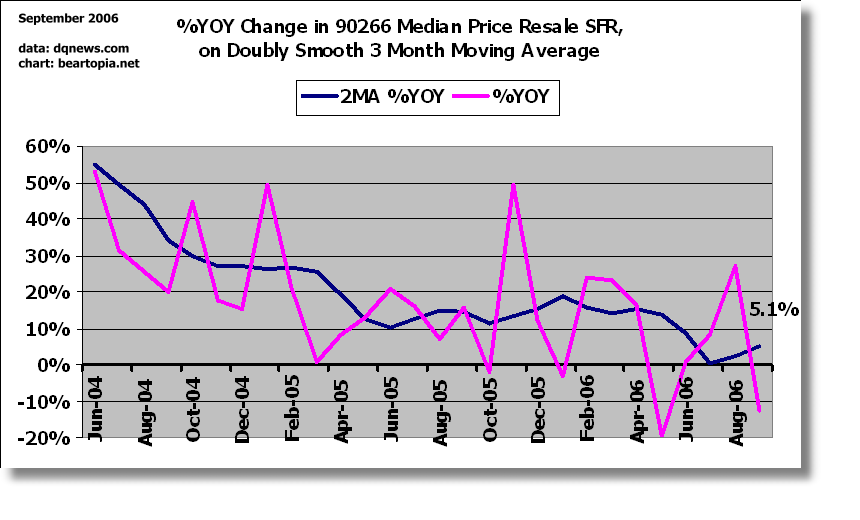
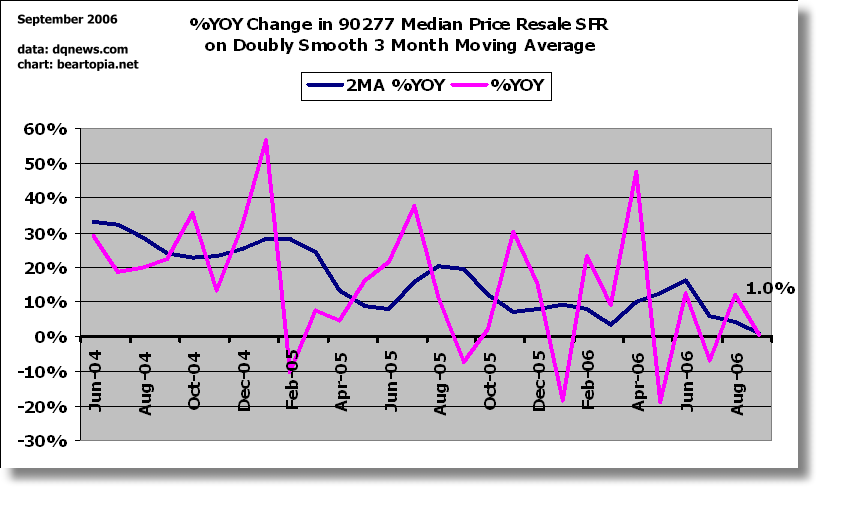
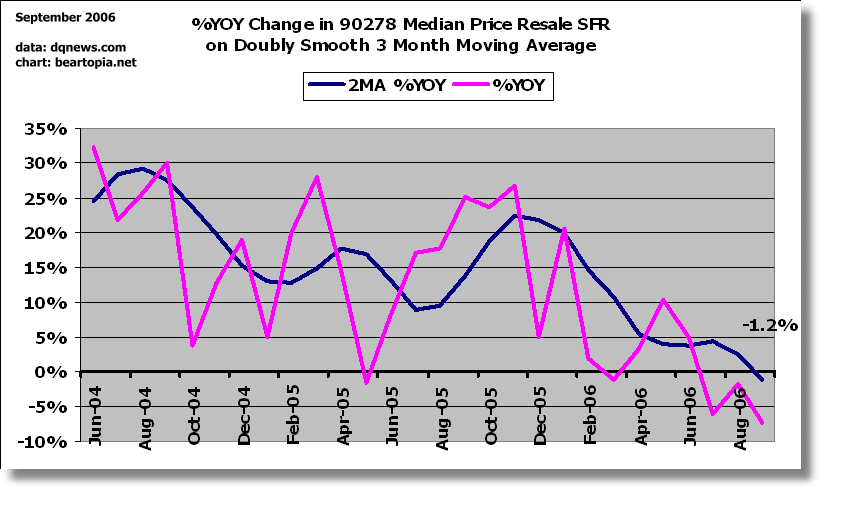
melissadata.com is required for getting historic information. It records total number of sales and average sale price by month for each zip code it tracks. I don't know exactly which zip codes melissadata.com covers so you'll have to find out for yourself. If I wish to cover a particular zip code, I get the data off the page and paste it into Notepad to clean it up. From there, I copy all the data from Notepad and paste it right into an spreadsheet, then I sort it by date so oldest date is on top. Normally it doesn't happen, but make sure there are no skipped months (some low-activity zip codes do have 0 sales for a month). If there is a missing month, I insert a record for that month showing 0 sales. So at this point column A contains the date, column B contains number of sales, and column C contains the average sale price. I put in column D a formula that multiplies B*C. That's the raw total dollar volume. In column E I calculate a simple 3 month moving average of column D. In column F I calculate a 3 month moving average of column E. In column G I do YOY calculations on column F. I then set up one table to show the raw data by year. That will be used to populate the raw column chart. I set up another table to show the doubled moving average by year. That is used to populate the moving average column chart. Then I use the column G YOY calculations to populate the YOY chart.

I copy and paste each chart into PhotoImpact to beautify it a bit, then save each chart out as a PNG (portable network graphic) file.

Since the worksheets are now set up, my work now consists of maintaining it monthly. For this purpose, I need to develop some Excel Visual Basic code, but it will take me a while to figure out - it's been nine years since I've hacked around in Excel VB.

Historical median price data is harder to come by, but it is doable without having to spend money for it. (Well OK, you might have to spend a few dollars for it copying stuff but that's nothing compared to buying individual research reports!) I got very lucky here. One blog reader who had been diligently archiving the monthly DQNews L.A. Times reports in an Excel workbook gave me a copy of her workbook. The only problem for you out-of-the-area visitors is that the data only covers beach cities. If this had not happened, I would have resorted to spending a few Saturdays at a library that microfilms back issues of the L.A. Times. The DQNews data is published in the second half of the month, and in Sunday editions. So you would have to look at maybe 2, at most 3 Sunday editions of the L.A. times per month to find and record your data. Go back as far as you like. If you do this, a laptop might be useful. Otherwise, take good neat readable notes and just enter the data in Excel when you get home. My schedule is packed for the next several months, but when things free up, I might just do this myself to collect much older data. I would really like to go back to 1989.

For inventory, sale, and DOM data, check the websites of your local realties and see if they publish that data. I had to rummage around in old news reports of Shorewood to get inventory and sale data for my local area. realtytimes.com might be a good source of information there. Be nice to your local realtors. I think that to survive in that business most realtors have to be genuinely nice people. And it's getting apparent that only the best ones are going to weather what lies ahead. Ask people you know who had a tough time selling their homes but who had realtors that went the extra mile for them. Find a few good realtors with well over a decade of experience behind them, and put links to them on your blog. They might just give you the numbers you are looking for.

My newest data gathering mechanism consists of running Apache server on my home PC along with PHP Admin and MySQL. I am hoping to construct a large enough database that better reflects certain statistics for my city (Redondo Beach). ziprealty.com is one website for finding listings by zip code. catalisthomes.com is another useful website. The open house listings in local papers are also a good data source for constructing records. PHPAdmin makes it pretty easy to enter new records quickly.

I have the database set up so that the full street address makes a unique key. This prevents me from entering duplicates into the database and it helps me spot homes that are getting relisted. So I don't always enter data exactly as I see it presented to me. If a new listing appears for 90278 and I see it's a record I already have in my database, then it's probably a relisting with the asking price reduced. So I keep the original asking price and listing date in the record, and then I fill in special fields for tracking reduced asking price and the date of reduction. This keeps the true time on market more honest, because my records don't "expire."

If that sounds too complicated for you, but you still want a systematic way of keeping records, you can use spreadsheets for that too.

As a special offer, if you start a new blog outside of 90278, 90277, 90266, and 90254 but in Los Angeles County, at minimum following the non heavy-duty number crunching blog suggestions (or improving on them), and post a minimum of two posts a week for 10 weeks, I will send you free the two-volume set Socionomics and Pioneering Studies in Socionomics. These books describe a whole different framework for studying and interpreting the world around us that goes way beyond the conventional analytical methods we learn in school (don't worry, it's not some weird religious cult). They certainly explain why I am a grizzly bear.

In terms of general market performance, 90254 resembles 90277, which I am at least partially covering. I cover 90278. There is a blog for 90266, check my map of housing bubble blogs. But I rarely get through 90245 (El Segundo), which technically is "my" area but it really deserves its own blog.

If you have any questions, please submit a comment. If you have better data collection suggestions for me or for anybody else who is interested in blogging (other than switching careers and becoming a realtor so I get the inside scoop!), please comment on that too!

Odds and ends from the L.A. Times

There is a trio of stories out on October 30 that says much about our psychology at this point in the real estate market.

First, homeowners with adjustable rate mortgages are nowhere near a panic point, if a survey conducted by Wells Fargo is accurate. Although some 80% of ARM homeowners are concerned about rising rates, about 20% believe they are prepared for rate adjustments and don't plan to change anything. And more than 50% believe they can refinance their loans.

Even more telling, 10% of all homeowners in this survey said they expect home values to increase "a lot", 53% said values would increase "a little", and 27% said values would stay "the same". Of the remaining 10%, they either weren't sure or were expecting a decline.

Why is this so telling? First, although the survey, if properly conducted, did so, the story does not break out "values will decline" into its own category - it just lumps it with "not sure." That suggests to me that the probability of housing value decline is still almost non-existent, in the mass public mind.

Second, I seriously wonder if there is any value in conducting this kind of survey when one considers what news the participants have recently been exposed to. In a recent L.A. Times story called "The Pain of Selling Your House", psychologist Barry Schwartz talks about how the power of suggestion can create anchors in our brains which we use to estimate the value of something. When values are presented to somebody in a way that they become anchored in the brain, they are then unconsciously used when formulating subsequent opinions about the value of something. As an example, for a few homeowners, a home's purchase price becomes an anchor. For other homeowners, a neighbor's recent sale price becomes an anchor. Getting back to this survey, if you are a homeowner, and you've been hearing news stories for much of the year about how median prices are still climbing, but the appreciation rate is really slowing down, is it any surprise that 53% of homeowners responded that home values would rise "a little?"

Now let's talk about St. Joseph. There have been stories this year about how desperate homesellers have resorted to burying statues of St. Joseph in their yards to help their homes sell. Religous goods suppliers report that sales of St. Joseph over Mary are running about 5 to 1. I won't elaborate much further, but I'll just say that in large scale boom times, we tend to think more along scientific lines, thinking we have the power and we are in control of things, and in macro bust times, when things spiral beyond our control, we like to turn to religion, our horoscope, Superman, or anything else that will help us struggle through.

And finally, we have complaints about Zillow.com. The story does not get into specifics, but a housing advocacy group complained to the FTC that values in Zillow are not accurate. The complaint states that Zillow's data is helping predatory lenders, real estate shysters and others "take advantage of unwitting consumers." So does the housing advocacy group think values are too high? Or too low? Or is the group complaing that Zillow swings wildly either way, being accurate only about 30% of the time? Shysters could take advantage of data if it were at either extreme, because there are a lot of vulnerable people out there. If prices are too high on Zillow and homeowners believe those prices, they may fall for the siren calls of hucksters who encourage them to borrow more against their house than it is worth. If prices are too low, and somebody is upside down on his mortgage, a huckster could panic somebody into "refinancing" into something more disastrous.

The market is in a state of flux, and anybody watching these markets carefully knows that values are shifting downward. Although Zillow does work to increase the accuracy of its estimates by crunching a lot of data, the estimates still lag what the market is doing now, which suggests Zillow's values are too high. However it wouldn't surprise me if your average homeowner looked up his property on Zillow and believed it to be too low.

I'm tacking this on late. There is a fourth story about how Capitol Hill will be looking to "tighten" homeownership writeoffs. Current law does not require local governments to report to the IRS what component of assessments collected are truly for property taxes, and what funds collected are for special-benefit assessments, which are not tax-deductible. And - you guessed it - many homeowners have been taking the whole writeoff, since it so often happens that the entire assessment is not broken out into what is tax deductible and what isn't. Other areas that are targeted for tightening is in the write-off of mortgage points, and in cash out refinancings. If cashouts were used for capital improvements, that would be considered legitimate and tax-deductible. If the cashout was used to buy a Hummer, a home entertainment system, or a vacation, these probably would not qualify. So the committee investigating these matters is proposing a red-flag system whereby the IRS would be alerted when loan values are increased by more than $100,000 in refinancings.

Monday, October 30, 2006

Third time's a charm? Look what's back on the market

I have blogged about this property numerous times, but I noticed it came up in the listings today. I first became aware of this property last Christmas vacation, when its asking price was $995,000. Since then, it has been re-re-re-re-listed and marked down to $889K, $869K, $849K, and $829K before that last listing expired. It is now back on the market with an asking price of $789,000, which is 20.7% below the original asking price. Although I think this still is a phantasmagorically astronomical asking price, it's not as far out of the galaxy as it was last December, so it's probably got a better chance of selling this time. It even falls out of the Zillow estimate range on the low end.

I think the problem with this property, other than that its original asking price was out in the Milky Way, is that the property is almost too nice for this part of the neighborhood. If people are going to continue buying real estate, I think they will be concerned about value and they will start remembering the old adages about buying real estate, like "Buy the cheapest property in the best neighborhood you can afford." Relative to the properties around it, this property is not cheap.

Sunday, October 29, 2006

Real Estate $$$ Transacted through October 2006

Since I'm putting this data out early, there is always the chance that this last weekend in October could be a magnificent real estate sale weekend which I have not captured. As I normally do, I will roll forward any adjustments that need to be made and include any October fixes that need to be made when I publish the November charts.

If you are new to this blog, be sure to read an explanation of these charts at the Beartopia real estate $$$ tracker. It is important to keep in mind that these are not price charts. Individual zip code charts can also be viewed from our Google Maps tool.

If the real estate market is supposed to have bottomed, I've seen very little evidence supporting that contention. The one "big" bounce I noticed was in 90277 (South Redondo), which went from a -35% YOY decline in $$$ transaction volume to a -26% YOY decline. Is that what the fuss was all about?

The one thing I noticed I kept doing while preparing these charts was that I had to keep adjusting the vertical axis on the left of the YOY charts to allow for more downward (negative) trend to develop.

In spite of that bounce in 90277 and still some strength in 90245 (El Segundo), the four beach cities have continued their downtrend, though at a slower pace. The beach cities are comprised of El Segundo, Hermosa Beach (90254), Manhattan Beach (90266), and Redondo Beach (90277 and 90278). On the YOY chart you can see that the rate of decline has slowed down a bit.

The more affordable areas that have been holdouts are also weakening. In the rankings for the area below, you can see that compared to last month, there are fewer zip codes in positive territory, and more areas are falling into negative territory. My groupings (and their labelings) are somewhat arbitrary. Keep in mind that all I did was take sorted output and place it in this post. There are individual zip codes in this list that may not necessarily "deserve" their ranking. If a market has been on steroids, coming down -22% from a YOY rate of , say, 800% is still a good sales pace! Take a look at the raw and moving average charts for an individual zip code to get a sense of its history before drawing any conclusions.

Real estate on steroids (realtors fat and happy):
90305 273.1% Inglewood
90301-90305 33.2% Inglewood/Lennox combined
90746 28.6% Carson
90304 24.6% Lennox
90245 22.1% El Segundo
Doing very well:
90043 19.0% Hyde Park, Windsor Hills
90037 11.6% South Central
90744 8.2% Wilmington
90062 7.8% South Central
Hanging in there:
90303 3.5% Inglewood
90047 3.4% South Central
90301 3.3% Inglewood
90260 2.4% Lawndale
Slip sliding away:
90302 -6.0% Inglewood
90044 -6.1% Athens
90745 -6.2% Carson
90502 -8.5% Torrance
90250 -8.6% Hawthorne
Losing a grip:
90018 -11.2% Jefferson Park
90501 -14.4% Torrance
90504 -14.6% Torrance
90266 -15.6% Manhattan Beach
90016 -18.3% West Adams
90230 -19.1% Culver City
90045 -20.0% Westchester
90094 -22.0% Playa Vista
90501-90505 -23.0% Torrance Combined
90249 -24.2% Gardena
About to go over a cliff (realtors getting hungry):
90277 -25.9% Redondo Beach (south)
90066 -26.7% Mar Vista
beach cities -27.1% 4 Beach Cities combined
90035 -29.2% West Fairfax
90019 -29.6% Country Club Park/Mid City
90036 -31.0% Park La Brea
90008 -31.4% Baldwin Hills / Leimart Park
90007 -32.5% South Central
90277-90278 -33.0% Redondo Beach combined
90505 -33.6% Torrance
90232 -33.7% Culver City
90503 -33.7% Torrance
90717 -37.3% Lomita
90278 -37.6% Redondo Beach (north)
90034 -37.8% Palms
90732 -41.8% San Pedro/Rancho PV
90291 -42.3% Venice
90293 -42.5% Playa del Rey
90056 -43.1% Ladera Heights
90292 -44.3% Marina del Rey
90254 -48.8% Hermosa Beach
90064 -49.7% Rancho Park/Cheviot Hills
Sliding down the cliff (realtors really hungry!):
90401-90405 -55.7% Santa Monica combined
90275 -65.7% Palos Verdes Estates

One thing I am now seeing in my own zip code (90278) is inventory starting to drop a little again. It was up in September, then dropped, then crept back up again, then this last week or so started dropping again. It could be an uptick in sales. Or it could be listings expiring. Time will tell. But for now, when combined with my other measures of activity and with the trends I am tracking in median prices, I find it impossible to believe that this market has bottomed and the deterioration we've seen will be repaired anytime soon, no matter how much hot air is blown by Greenspan and others.

By the way, an October 29 L.A. Times story by Diane Wedner titled "Not an agent's market either" discusses what we have been suspecting - this is becoming an extremely tough business for realtors to be in, and some are leaving the industry or taking on other jobs. According to data in the story, about 85% of sales are transacted by 15% of realtors. With a shrinking real estate $$$ pie, that doesn't leave much to go around to the remaining 85% of agents.

Saturday, October 28, 2006

L.A. Times: Home prices take steepest dive in 35 years

You've probably heard the news by now, but we'll note it here for the record, even though this is not news specific to our region. On a national level, September new home prices have taken their biggest YOY drop since 1971. The national median price has dropped 9.7% to $217,000 (oh if only we had those prices in California). Sales volume is also down 14.2% YOY.

And what's more, previous months keep getting downwardly revised. And on top of that, even the revised numbers do not reflect contract cancellations! Pretty scary, isn't it, when you consider the new cars, vacations, pools, granite countertops, cash back, and other gimmicks that builders throw in there to keep from lowering the asking price. And what's weird is that we've barely begun to really see the noticeable effects from this decline yet. It is just warming up. Do the bottom-boosters still think this market has bottomed?

One point of interest to me is that the article states that there were "signs of improvement", noting that September sales were up from August. At this stage in the downturn, it appears the psychology is such that people are still hopeful this will all be over soon, and they are digging through piles of horse manure looking for diamonds, which may turn out to be zirconium. This improvement cited is meaningless anyway, since the figures keep getting downwardly revised later.

Check this October 26, 2006 story by Jesus Sanchez for further details.

Thursday, October 26, 2006

Other measures of Beach Cities market activity, September 2006

(Sorry this was not originally posted at the time originally promised. Shorewood suffered a glitch getting their data from a third party.)

If you're a South Bay housing bear, don't let all the media hype about a bottom in the housing market fool you. Shorewood Realtors is now reporting a decline in the median house price for the beach cities of El Segundo, Hermosa Beach, Manhattan Beach, and Redondo Beach, although it's not called a decline; the news release just states that the price is "edging downward." So psychologically, we've reached a point where it's acceptable to say that sales are declining, because that is stating the glaringly and painfully obvious, but since prices are just barely off their year-ago levels, they are only "edging downward."

Can't you just feel how much hope is still built into this market? When we say that prices are "edging downward", it almost sounds like prices are easily reversible, doesn't it? Can't you just picture prices dipping their toes in the water of a pool, deciding it is too cold, then stepping back from that scary edge? Prices are merely standing with toes to the edge - they haven't fallen over a cliff - all they have to do is step back. Oh, if only it were that simple.

DOM is not showing much change. I have been very unsatisfied with the DOM data available to me so I'm hoping that the data I'm collecting will reveal a more truthful DOM in four or five months time. We've gotten to the point where DOM is now severely affected because inventories are growing like crazy, and so many houses are now getting listed multiple times. But in spite of these problems, the DOM is at least not showing any significant reversal. Even with expired listings and relistings, the DOM is meandering flat to upward.

My own Housing Supply Strength (aka Demand Weakness) is telling a more dramatic story though. This measure is my own device, where I simply take (inventory-sales)/sales, or (I-S)/S and plot both it and its moving average. If inventory equalled sales, the graph would touch 0, which it did indeed do in late spring 2005. If there were no sales, the graph would trend to infinity. If this measure is of any value, then spring 2005 was officially "the market top" for the beach cities. The moving average has now pushed up to 3.62.

The only problem I have with it is that the data does not go back far enough to a market that the experienced oldtimer realtors would call "normal." So I don't know what number I would expect to see on this graph that equates to a normal market. Many realtors are calling this current market now a return to more normal conditions, so maybe 3.62 is very normal.

Wednesday, October 25, 2006

L.A. Times: Existing home sales drop 1/3 from 05

Wow, I'm impressed. The word plunge appeared on the front page of the L.A. Times website, though the actual story title is not quite so dramatic. Anyway, the October 26 story by Jesus Sanchez sort of tells us what we already know.

The California median sale price for existing SFRs is now $553,050. It still blows my mind that the median price in this state is over half a megabuck. In this golden state, we have truly lost our senses. Maybe we've been out in the sun too long.

September sales fell YOY by 31.7%. The median number of days it now takes to complete a sale (I'm not sure if they mean "days on market") is now 54, up from 30.

Leslie Appleton-Young, the chief economist at the California Associaton of Realtors (CAR), observes that areas where there has been a lot of building and areas where there have been active second-home markets are the areas getting hit with bigger sale declines and weaker prices. So far, California is running well ahead of the nation, which shows a 14.2% slip in home sales for September.

And now for further information from CAR. The organization's unsold inventory index now stands at 7 months, up from 3.2 a year ago. 227 out of 381 California communities (59.6%), still are experiencing rising median home prices. It's hard to kill a good bubble, isn't it?

For Los Angeles, the September median resale home price is $585,730, -0.7% from August but up 4.4% YOY.

Tonight I'll try to put up other measures of beach cities market activity for September.

Saturday, October 21, 2006

From the South Bay bubble scrapbook

It's time to grit our teeth and be prepared for some rebound in the local housing markets. I don't know how much of a retrace there will be, or how long it will last, but I suspect it won't be much, because inventory has been creeping back up, at least in 90278. The stock market, too, is hitting new highs (at least the Dow), and it is not showing fear or giving any sign of trouble ahead, as it has historically done. There is some truly awful economic data out there, but the cheerleaders on CNBC and elsewhere spin it and explain it away, as is typical in the mass psychology of economic and market peaks.

In an earlier post I wondered out loud if the bubble could be shifting to the low end. Another possibility is that we could be getting a bifurcated market, where the credit bubble is moving from the middle range to the lower end, and perhaps to the upper end. One reason I think about this is because Centex is raising its prices on the Fusion townhomes in Hawthorne, not lowering them. Not by much, but the change is symbolic of the fact that there is demand. Residence A, which once started at $517,000, now starts at $520,000. Residence C once started at $601,500 and now goes for $610,500. Residence D once started at about $601,000 is now $611,000. And when this project was first getting started, I think the tentative price for Residence A was in the $400,000's. Residence A units in particular would be considered fairly "low end" for the area - probably standard for Hawthorne but this place is trying to pretend it's in Manhattan Beach, so Centex is trying to convince you it's a great deal for Manhattan Beach!

Another indication of why this market could be bifurcating is illustrated here. Here is a decent house, which with some beautification would make a fine living place for somebody, but apparently it's going to be torn down and some luxury condos are going to be built in its place (you have to click on the picture to really read the sign). It's pretty bad when a realtor can't or won't sell a mid-range house, but is fine with tearing it down to put up some high-end condos. It always infuriates me when I see this going on. This is exactly what happened to the lovely house across the street from me, which would have made a great (more relatively affordable) house for a family, but it was torn down and two higher-end condos put in its place. If you've read my prior posts on that house across the street, I strongly suspect that the family in that house is unable to make their payments. Maybe they would have been able to comfortably make the payments if they had bought the original house standing there, which sold about three years ago for about $620,000.

A lot of homes have recently been sold! The garage sale signs are getting so thick on these telephone poles that they are crowding each other out.

I swear I did not post the sign in the photo below. It was obviously posted by a lender who's trying to make money off of refis.

You'd think with all the press about the more creative mortgages that they'd be banned by now. Or discouraged. Or frowned upon. Nope. Zero down makes a good selling point, as shown by this open house sign (click to see). And by the way, what's with the hand made signs? Weren't they able to afford some more polished and professional looking ones?

This photo cracks me up. There is a little sliver of Manhattan Beach (90266) on the east side of Aviation Blvd. And there is a complex of townhomes on Aviation Way called Manhattan Pointe that officially are in 90266. The big selling point here is that it is Manhattan Beach, not some wannabe like Redondo, even though Redondo Beach is literally on the other side of this little street. I took a flyer but there is no price listed. Nor is the property listed in Zip Realty. Oops, I forgot. If you have to ask the price, you can't afford it. That realtor, by the way, is probably one of the most prominent realtors in the area. I believe he has a business built around sports star relocation to Manhattan Beach.

My conclusion from all this? The builders aren't scared, they are plowing ahead with their plans to build luxury condos. Buyers aren't scared, they aren't seriously thinking about affordability yet, they still go for "zero down" like flies to dog poop, even though there is literally a sign hanging in this neighborhood saying that home values are dropping! (Why am I getting a vision of lemmings running off a cliff?)

All that's been happening this year is that the wind got knocked out of price momentum. That means that some realtors are working a lot harder to maintain the incomes they've achieved in recent years, and a few realtors have probably gotten out of the business because there are fewer slices of pie to go around. Higher-end realtors are still doing OK. Overall, there is still no fear. Maybe that's in store for 2007.

Thursday, October 19, 2006

DQNews South Bay Resale Activity for September 2006

According to DQNews, the September monthly resale activity for the south bay area showed the following:

Zip       # SFR   Median   %Chg   # Condo  Median    %Chg 
          Sales   $SFR      YOY    Sales   $Condo     YOY
90045      23     799,000   3.4      4     380,000   10.0
90245       3     680,000 -22.6      2     525,000   -2.8      
90254       9   1,030,000 -12.0      6   1,070,000  -14.4   
90260      18     548,000  11.1      5     438,000   30.7
90266      31   1,379,000 -13.8      6   1,701,000   48.6
90277      14     883,000   0.4     10     708,000    7.6 
90278      26     769,000  -9.5     21     710,000   -1.4

County  5,588     541,000   3.0  1,436     406,000    0.2

The beach cities charts below look strictly at resale activity for existing SFRs. The pink line is the raw %YOY change in the median price. The dark blue line is the %YOY on a doubly smooth 3 month moving average of the median price. I like to take moving averages because seasonal activity does not always "match up" (e.g., sometimes Easter sales fall more in March, sometimes more in April.) Beach cities zip codes are 90245 (El Segundo), 90254 (Hermosa Beach), 90266 (Manhattan Beach), 90277 (south Redondo Beach), and 90278 (north Redondo Beach).

The raw %YOY changes in my calculations (which I do not publish) do not always precisely match the DQNews published percentages, possibly because DataQuick might need to go back and revise already-published months. However, the differences are slight, and trends correspond very closely.

The percentages shown on the charts are for the Moving Average point for September. Moving Average is a lagging indicator, and it gives a much more conservative analysis of change than the raw numbers. MA gives generous leeway to the bubbleheads who are declaring that a bottom has been reached in the housing market. Based on this MA, median SFR prices for 90245, 90254, and 90278 are now in negative territory. But as you can see, 90277 is the only beach city zip code whose pink line (raw data) has not fallen below 0% into negative territory. A chart for L.A. County has been added, which shows a %YOY gain of 7% - again, very generous leeway to the bubbleheads.

L.A. Times: More Homeowners Going into Default - "We have a lot of people who got mortgages when they really shouldn't have qualified"

Los Angeles Times bubblewatchers David Streitfeld and Martin Zimmerman continue to report on rising mortgage default rates in California. For California as a whole, notices of mortgage default are 26,705, up about 111.8% in Q3 YOY from 2005, according to DataQuick. Here in Los Angeles County, the number of notices are at 5,565 in Q3, up 72.1% YOY from 2005. In fact, L.A. County is the only county in the six county region of Southern California where the percentage increase was not in triple digits.

The last time we reported on notices of mortgage default, the L.A. Times said that relatively few homes actually end up in foreclosure, because homeowners can sell before the bank can seize the property. The attitude that prevailed when that was reported was that homeowners in trouble can sell their way out of trouble into a booming market. But in today's story, DataQuick reports that 19% of the owners who went into default earlier in the year actually lost their homes to foreclosure in Q3, triple the 6% rate in 2005. Furthermore, more than half the loans that went into default in Q3 were made in 2005. So selling their way out of trouble is not an option at this time. Homeowners in default were a median five months behind on payments, and median delinquent debt was $9,829 on a $306,000 mortgage.

TerraCotta Group in Manhattan Beach is doing a booming business helping homeowners stay out of foreclosure. Well over two years ago, typically two or three people a day would come through the door. Now it's more like 30 to 40 a day. Credit counselors, too, are feeling the increased workload from the fallout of adjust rate loan resets.

The defaults are falling particularly hard on the entry level market in Southern California, where homeowners typically do not have reserves to fall back on in case of a financial crisis.

Of course the story continues to cling to hope, which is starting to be a nasty four-letter word. Experts think that defaults and actual foreclosures will continue to grow, but almost nobody is talking about a housing market collapse, even though they readily admit that foreclosures put downward pressure on prices. "Collapse" is the forbidden C- word. One DataQuick analyst says, "I don't think it's time to panic...this is a natural turning of the business cycle." Another one says, "I'm not convinced the numbers are going to continue going up at this rate, unless something major happens to the economy." Hope abounds in that tired old argument about how diversified the state economy is and how much stronger it is. Then the story goes on to say that there has not been a repeat of the 1980's building boom, which created an oversupply of homes.

Huh? Supply is fueled in part by demand, and when that demand gets up and walks away, as it appears to be doing in some places, then you can have an oversupply literally overnight.

Monday, October 16, 2006

L.A. Times: Tepid home market still cooling

This news is a few days old, but I'll post it anyway for a more complete record. According to an October 12, 2006 short piece by L.A. Times writer Jesus Sanchez, September 2006 home prices for the six-county area of Southern California were as follows (data is from DataQuick):

County            Median Price    YOY Change    YOY Sales Volume Change
Los Angeles        $509,000       3.0%          -27.9%
Orange             $626,000       2.6%          -34.6%
Riverside          $423,000       8.2%          -24.5%
San Bernadino      $365,000       3.7%          -25.8%
San Diego          $476,000       -4.4%         -35%
Ventura            $584,000       -3.3%         -20.5%

Entire Region      $484,000       1.9%          -28.6%

Home sales volume is down over 28% and prices are rising at their slowest pace in over 9 1/2 years. As we've already noted, Ventura home prices have now joined San Diego on the depreciating side.

As I've been saying now in a few posts, Federal Reserve officials have been flapping their lips about the possibility of a bottom in the housing market decline, and point to at least three sets of data to support their statements. Yes, I know, it's laughable, as the downhill roll has barely even started here. For now I am assuming that bear markets don't always plunge straight down - sometimes they pause or bounce back a little along the way down. From the dollar volume charts we've seen here we know that our local markets have incurred substantial technical damage - damage that won't magically repair itself overnight.

Still, I am bracing myself for the possibility of a mild rebound in the sales numbers, which is fine, but more annoyingly, lots of press and hype in the media trumpeting a successful soft landing. It will take some fortitude to resist the siren calls and social pressure of family, friends, neighbors, acquaintances telling you that now is the time to buy, after having thought that you are nuts because you were in such a hurry to get out of this bubble and actually dumped your house to do so.

Friday, October 13, 2006

L.A. Times: Would-Be Home Sellers Settle In Rather Than Cut Prices Further

According to this October 13, 2006 L.A. Times story by local market watcher Annette Haddad, Southern California homesellers are taking their marbles and going home. Almost literally. Buyer and seller have been locked eyeball to eyeball, and the seller is refusing to budge.

According to the story, inventory has dropped. Buyers are giving up on selling so they are pulling their homes off the market. Apparently the housing bears have been a bit too quick in showing their upper hand (or should I say claw?). Low-ball offers are being rejected.

Foreclosures have been rising, but they are still at a very low level compared to previous downturns. The job market and the economy are in a holding pattern, the article states, therefore sellers aren't under particular pressure to sell their homes.

One expert says that a reduction in home listings is "one of the preconditions to stabilization in the housing market... and that's a good sign."

And here we have some data on September activity in Los Angeles County. Apparently the median home price (all homes) rose to $509,000, up 3%. Sales fell 27.9%. Apparently, all price gains since May have been given back. Orange County, too, saw a median home price rise to $626,000, up 2.6%, while sales declined 34.6%. Riverside County median price rose 8.2% to $423,000 (this is an "affordable" area, remember) and San Bernadino county median price rose 3.7% to $365,000.

The article does say that the reduction in inventory does not seem to be stimulating buyer interest. Esmael Adibi, an economist at Chapman University, fears that "weak sales will continue to drag down prices, sapping equity from recent home buyers who are counting on appreciation to offset their mortgage debt." He says, "the market hasn't gone into that desperation mode yet, but we see it as in the earliest stage of the downward pressure on prices." He thinks that a year from now, inventory could be "considerably higher", due to recent home buyers with risky mortgages facing the need to sell if they run into trouble making payments. "How many of this group will be able to get out of a bad situation...if they face payment shock or financial distress and will need to sell?"

If my two cents is worth anything, I've been seeing inventory increase in the South Bay on Zip Realty, not decrease. Inventory did dip into September, but it has been slowly climbing back up again. Just tracking 90278 alone on Zip Realty, inventory had been as high as 260, then went down to about 230, and is now back up around 250. Price reductions are also creeping back up. They had been in the 130's, had gone down into the 110's, and are now back up in the 120's.

In those areas where inventory actually did decrease, what are realtors going to do? Start their "Hurry up, buy now before it's too late!" campaigns? What ever happened to "Now is a great time to buy, there are more homes to choose from!"

I have been wrong many times in the past about when and how bubbles will burst, and I could be wrong again. But I just don't think that collectively, it is in our psychological makeup to all join hands and sing "Michael Row Your Boat Ashore", as we pass around houses to each other, slivering a few $K here and there off prices, distributing the financial pain in a benevolent, uniform, serene way. No, I think somebody who really needs to sell is going to crack, and deeply cut his asking price. Once that happens, other sellers will get angry because they now have to face the reality of prices falling hard, and then if they need to sell they'll be forced to follow the slope down.

I think Esmael Adibi has more going for him than the economists at either the Anderson School at UCLA or the Lusk Center at USC!

Right now, it looks like there has been a very recent sales spurt in my area. This might be somewhat related to the recent decline in longer-term interest rates and the jump in new mortgage applications. This could be what the bubblonians such as Greenspan are trumpeting as a recovery (even though our local inventory is creeping back up). Let's continue to keep an eye on things.

Associated Press: SoCal home sales drop 28.6% from last September

There are no details yet about Los Angeles County in this Associated Press story. The noteworthy item in this news release is that Ventura County has now joined San Diego County in terms of showing YOY median price decline. Price growth is still occurring but still slowing in Los Angeles, Orange, San Bernadino, and Riverside counties.

Contrary to what former Fed chief Alan Greenspan has been saying about the worst being over for the housing market, it does not look like the slide down here has even paused yet. Greenspan made those comments in light of a recent jump in applications for new mortgages. Greenspan also claims that "the fall of communism" unleashed tons of cheap labor into the world, creating a disinflationary environment that lowered inflation risks, which created the housing boom. I am not kidding, he actually said that. I'm sure he'll say anything to avoid responsibility for fueling a housing bubble with cheap money and casino loans.

Current Fed chairman Ben Bernanke, on the other hand, believes the housing market is still undergoing a "substantial correction."

Home sales drop 28.6% from last September
Six counties in Southern California posted a 9-year low for the month. Median prices
rise only slightly.
By Alex Veiga
THE ASSOCIATED PRESS

Home sales fell last month in a six-county stretch of Southern California to the 
lowest level for September in nine years, a real estate research firm said Thursday.

A total of 22,654 new and resale houses and condominiums were sold in September in 
Los Angeles, San Diego, Orange, Riverside, San Bernardino and Ventura counties, 
according to DataQuick Information Systems.

The figure represents a 28.6 percent decline from the year-ago period, when 31,740 
homes were sold in the region.

September sales were the lowest for the month since 21,320 homes were sold during the 
month in 1997.

September also marked the 10th straight month that sales in Southern California 
declined on a year-over-year basis.

Meanwhile, San Diego and Ventura counties saw their median home prices fall in 
September on an annual basis by 4.4 percent and 3.3 percent, respectively. Price 
growth slowed in other counties, according to DataQuick.

The median home price in the region hit $484,000, marking a 1.9 percent increase 
over the year-ago period. It was the smallest percentage increase since February
1997, when the median price inched up 1.3 percent to $160,000, compared to $158,000
in February 1996, the firm said.

September's median home price fell 1 percent compared to the August figure.

Riverside County's median home price rose 8.2 percent over last year, to lead the 
region.

Statewide home sales data for September are expected Tuesday.

Thursday, October 12, 2006

Daily Breeze: California has lead in new foreclosures

I was not able to find this story online, but it so happens that Bruce brought home a copy of the Daily Breeze today (October 12), and the story is on the front page of the Business section.

With a 19 percent increase in foreclosure activity, California leap-frogged past
Texas and Florida to report the most new filings of any state last month, an 
Irvine-based online marketplace for foreclosure properties reported Wednesday.

The state documented 14,806 properties entering some stage of foreclosure, nearly 
three times the number reported in September 2005 and a foreclosure rate of one new 
foreclosure filing for every 825 households - 1.3 times the national average
according to RealtyTrac.

The state's foreclosure activity has risen more than 40% during the past two months.
Nationwide, about 112,210 properties entered some stage of foreclosure last month,
down less than 1% from August, and a 63% increase from September 2005.

Greater West Los Angeles Chamber of Commerce: Sign of the Times

There is a short notice in the Greater West Los Angeles Business Monthly newspaper October edition (not yet online) talking about the proliferation of open house signs in the west side.

According to this story by Jay Handal, the number of realtor signs in the medians of the major streets in Brentwood and Westwood have jumped. At Gorham and San Vicente, 20 signs recently occupied 2 corners of the intersection. It's getting so crowded with realtor signs that people cannot pass on the sidewalk. And the Chamber of Commerce has been receiving numerous complaints.

Apparently, leaving frame and poster signage out on the streets and sidewalksis illegal and so the Chamber of Commerce threatening to have anybody cited and fined as well as confiscating the illegal signs.

The article even has a picture of a human sign twirler standing out in one of these street medians, and there is another photograph showing the clutter of signs on one corner.

I was amused by this article because I've been thinking, "Hmm, this is only going to get worse! Either they better get used to it, or realtors or going to have to come up with other ways to advertise their open houses." Maybe on the sides of buses? Pay people to wear printed t-shirts? Fly a plane with a banner overhead? The Goodyear blimp? But those choices could get expensive!

Wednesday, October 11, 2006

Update on 3022 Naatab

The please call... sign is now down.

But I can't say the asking price is down by much on this foreclosure.

The history I know about is as follows. New bubbleminium construction sold in March 2004 for $810,000. Mystery sale April 24, 2006 for $890,137. Listed by bank in June for $989,900. $5K got slivered off the price in July. Now there was another price reduction on September 26 down to $949,900. A total reduction off the June asking price by 4%. Best DOM estimate 120 days and counting.

This is a very patchy history, and I am admittedly a country bumpkin in matters of real estate finance - I like to keep things real simple. The flyer I have says "foreclosure" but I am trying to figure out what could have happened between April and June that this went into foreclosure so quick! The L.A. County tax assessor does not show a recorded sale in April. So maybe the April transaction was not a sale but something else, even though Zillow calls it a sale, and the real foreclosee was the party who bought in March 2004?

A resale back at about $810,000 would put the drop from original asking price at about 18%. I think that's very possible.

Monday, October 09, 2006

Los Angeles Business Journal: Stabilizing Home Prices Fuel Hope of Soft Landing - "People don't give up on their house-price dream"

Los Angeles County and South Bay bubble watchers shouldn't miss this October 9, 2006 story by Daniel Miller in the Los Angeles Business Journal (registration and/or subscription required).

Soft landing hopes are in the air because even though the number of existing homes sold in L.A. county dropped 30% in September YOY, and the median price is the same as the previous two months, the price is still up 4.2% YOY. The median price has been "stuck" at or near $550,000 for six straight months. According to the article, talk about a bubble bursting and prices dropping has gotten quieter for now. (Gee, somebody forgot to tell me to pipe down!)

Economists at the USC Lusk Center for Real Estate claim, "The indicators we are seeing are consistent with a soft landing. The market is stabilizing to some degree. But we need more time." Other observers point out that the economy is regionally strong, and unemployment is low. Because of the soft sales and flattened prices some argue it "feels" like a downturn, and it "looks like" doom and gloom when you come off the extreme sellers market that we've had.

According to CAR, DOM for homes in L.A. County in August was a median 51.9 days, compared to 29.2 days August 2005. The inventory buildup in August was 6.8 months, compared to 2.6 months August 2005. According to Leslie Appleton-Young, a six month supply creates a "balanced" market. And, According to Appleton-Young, since 1988, the average unsold inventory level is 6.9 months.

Steve White of the Southland Regional Association of Realtors says that 2005 was "complete insanity" so it was difficult to use as a benchmark, but for that matter so are "2004 or 2003... those years were so far away from normal."

Nor does UC Berkeley see a regional recession for Los Angeles in the cards, though a professor there does not think it is clear the market has found its level.

And what are buyers doing? They are waiting because they "want to feel they are getting a good value." Because people are so unwilling to give up their house price dreams, high-end home sales are being impacted. The same analyst explained, "I feel that a lot of people wanted things to pick up after Labor Day but when we see things close, sale prices aren't close to the asking or over the asking prices as they used to be."

Still another analyst explained that in the summer, families relocate and prepare for the school year, generally making summer a strong time. There is normally a seasonal reduction from August to December.

But the analysts remain upbeat. "There is nothing in the Southern California economy that will portend doom", said one.

-----------------------

There are a number of points I'd like to make in relation to this article:

1. Buyers want to feel like they are getting a good value. But the notion of what constitutes good value can change practically overnight. The great deal this year can look like a disaster next year, if current underlying trends continue.

2. Gee, was Steve White complaining in 2003, 2004, and 2005 that the market was abnormal and that it would eventually correct, or was he claiming the markets would continue seeing "healthy appreciation" like so many realtors have?

3. Gee, I wish these economists would explain the last time we had a soft landing and what their indicators looked like then.

4. One thing I've been trying to do in this blog is look for leading indicators. Although the moving averages I take of real estate transaction dollar volume is a lagging indicator of that volume, I am operating on the theory that it will be a leading indicator of prices, since we have been seeing the real estate industry impacted. A September 22 L.A. Times story by E. Scott Reckard and Annette Haddad called Waning Sales Take Further Toll on the Industry (which I did not blog) illustrates this point. Many of the YOY moving average charts are well below 0%. So even if the the moving average charts were to level off at this point, that would mean that dollar volume is declining at a steady rate. That's definitely not good for the people in the industry. I've also been looking at moving averages of DOM and I-S/S to see if they serve as leading indicators of price action. Although they appear to corroborate the dollar volume charts, unfortunately the data does not go back far enough to the time of a "normal" market to see what these numbers might have looked like at that time. So if the market were to magically "recover" at this point in time, I would not know what to look for on these charts.

5. According to the moving averages I've been taking of the median existing SFR sale prices in the beach cities, the rate of price appreciation is slowing, meaning that the trendline is sloping downward, towards 0%. For a few beach cities, the trend is already below 0%. SFRs tend to be higher end than condos. If we manage to kick this credit bubble can down the road a few more years, I think we could see the bubble shift toward the lower end, as I wondered about in another post.

-----------------------

Stablizing Home Prices Fuel Hope Of Soft Landing
By DANIEL MILLER - 10/9/2006
Los Angeles Business Journal Staff

The expected drop in Los Angeles County home prices didn’t happen again in September,
leading some observers to wonder if the housing market may experience a soft landing.

According to data released to the Business Journal, the number of existing homes sold
in Los Angeles County in September dropped 30 percent – about the same as the 
previous month. But the median price of homes sold was $550,000 – exactly the same as 
the previous two months. What’s more, the price is up 4.2 percent from the same month 
last year.

When the number of home sales started dropping almost a year ago, many observers 
expected prices to head south eventually. However, the median price has been stuck at 
or near the $550,000 level for six straight months.

The result: the talk of price swoons and the housing “bubble” bursting has gotten 
quieter – at least for now.

“The indicators we are seeing are consistent with a soft landing,” said Delores 
Conway, director of the Casden Real Estate Economics Forecast at the USC Lusk Center 
for Real Estate. “The market is stabilizing to some degree. But we still need more 
time.”

Indeed, no one has a crystal ball, and prices may well drop, especially if 
predictions that lenders seeking to cash in on the real estate boom issued no doc 
loans – requiring minimal verification of income and assets – to overextended buyers 
are true.

That could lead to a rush of foreclosures as the interest rates on the loans adjust 
upward after their initial introductory period, when their rock bottom interest rates 
expire. A recession would certainly push prices well down.

However, several observers pointed out that the regionally strong economy and 
historically low unemployment don’t appear to set up the Los Angeles area for a steep 
price plunge.

In fact, so far this year the median home price in the county has risen from $519,000 
in January, according to data provided to the Business Journal by HomeData Corp., a 
Melville, N.Y. company that tracks housing prices nationwide. Still, the soft sales 
and flattened prices feel like a downturn, compared to the torrid sales of recent 
years.

“When you come off of an extreme sellers market it looks like doom and gloom,” said 
Steve White, president of the Southland Regional Association of Realtors. “And the 
fact that the year-to-year median price has increased moderately would show you we 
are in a relatively strong market.”

Homes Sitting

To be sure, even though median prices have not gone down yet, sales are definitely 
slower.

Cory Weiss, a broker in Prudential Real Estate’s Beverly Hills office, said homes 
that are realistically priced are selling, albeit at a slower pace.

“Buyers are being cautious. They are taking their time. Deals are taking longer as 
far as negotiation,” said Weiss, who has clients in Beverly Hills, Brentwood and the 
Palisades area.

Weiss’ experience is in line with data released by the California Association of 
Realtors.

The California Association of Realtors estimates that as of August, homes in Los 
Angeles County were staying on the market a median 51.9 days, compared to 29.2 days a 
year ago. That translates into a build up of county inventory levels to 6.8 months in 
August, compared to 2.6 months a year earlier. That means at the current pace of 
sales, it would take 6.8 months to sell everything that’s on the market now.

“Where homes were moving in a week with multiple offers, it seems to be between 30 
and 60 days or perhaps longer now,” said Fran Butler, president-elect of the 
California Escrow Association.

According to Leslie Appleton-Young, chief economist with CAR, a six-month supply of 
homes creates a balanced market for buyers and sellers.

Appleton-Young said that since 1988, the average unsold inventory level for homes in 
the county is 6.9 months.

White said that the current county home market is balanced, though it is hard to 
recognize that after the price gains the region experienced from 2003 to 2005.

“Last year was just complete insanity in many ways, so it was difficult to use 2005 
as a benchmark or 2004 or 2003 for that matter,” White said. “Those years were so far 
away from normal.”

Bob Edelstein, professor of business administration at the University of California 
Berkeley Haas School of Business, said that while it is not clear whether the market 
has “found its level” he does not anticipate a regional recession, which would 
severely impact the housing market.

“The business sector is fairly healthy,” Conway said. “If that changes we could see 
more of a bumpy landing.”

Buyers Taking Time

Weiss said that in the high-end market, properties do still sometimes receive 
multiple offers from prospective buyers, though buyers are no longer consistently 
making offers at or above asking prices.

He said that homes that have sat on the market are “seeing reductions in price as 
buyers are being more particular.”

In the Santa Monica 90405 ZIP code, September sales dropped 32 percent to 13 homes 
sold, with the median price down 12 percent to $1.1 million. In the Brentwood 90049 
ZIP code, September sales dropped 55 percent to 10 homes sold, with the median price 
down 14 percent to $1.4 million.

“I still have a ton of active buyers in the upper-end market but they are holding out 
and want to feel like they are getting a good value,” Weiss said.

Edelstein said that countywide slowdown is part of a typical correction before the 
market turns around.

“People don’t give up on their house-price dream, but the idea that there are fewer 
sales means that less people are getting their dreams,” said Edelstein, co-chair of 
the Fisher Center for Real Estate and Urban Economics at UC Berkeley.

As the market continues to correct, there are fewer high-end homes selling. In 
September, 610 $1 million-plus homes were sold, down from 899 $1 million-plus homes 
sold in August.

Also, there were just 31 $1 million-plus ZIP codes in September, down from 38 such 
ZIP codes in August.

“I feel that a lot of people wanted things to pick up after Labor Day but when we see 
things close, sale prices aren’t as close to the asking or over the asking prices as 
they used to be,” Weiss said.

The county condo market also experienced a 30 percent decline in sales volume to 
1,463 condos sold. The median condo price in the county rose 0.5 percent from a year 
ago to $410,000.

Conway said that seasonal factors will likely lead to a further decrease in the 
number of transactions during the late fall and winter months. This sort of seasonal 
reduction in volume is an annual occurrence for the housing market.

Conway said that in the summer months, families relocate and prepare for the school 
year, generally making that period a strong time for the market.

“Typically we have a decline from August to December,” Appleton-Young said. “I would 
expect that pattern to hold.”

Despite this expected decline, many real estate professionals said the market appears 
to be functioning normally. “There is nothing in the Southern California economy that 
will portend doom,” White said.

Sunday, October 08, 2006

Is the Bubble shifting to the low end?

There are plenty more condo conversions and condos headed our way here in the South Bay area.

First I'll mention San Pedro Harbor View. Brought to you by SoCal Homes, LLC, specializing in condo conversions in places less than 50 units in size. In their campaign to make owners of homes wealthy, and supported by the author of the Automatic Millionaire Homeowner (I don't make this stuff up!), they bring you this San Pedro project.

As best as I can tell, there are 33 units. With the exception of unit #18, which is 1309 square feet, all of them are less than 1000 square feet, and most of them appear to have 2 bedrooms, with the remaining being 1 bedroom.

In the comments to a previous post, I described what I went through when I lived in a condo, in terms of the density and the out-of-control kids. A reader talked about seeing large families visiting the tiny condos in a development he was interested in, with every intention of cramming maybe four children into one bedroom in a small 2 bedroom place.

Now, are you wondering what is happening to the property that used to house the Los Angeles Air Force Base? The base has been torn down. According to the April 24, 2006 meeting notes of the Hollyglen Homeowners Association, William Lyons is planning on building some 625 homes there.

Garden Court will consist of 2 and 3 story townhouses, 1700-2700 square feet, highest price estimated at $900,000. Row Town, along El Segundo Blvd, will contain 1500-2000 square feet 3 story townhomes, in brownstone colors. No price info. Motor Court will have 1500-2000 square feet 3 story townhomes, also decorated in brownstone colors. No price info. Urban, which will be along the Aviation Blvd side, will have urban lofts 1100-1800 square feet, decorated in brownstone colors. No price info. Stacked Flats, which will be in the middle of the property, will be 4 story flats, 900-1700 square feet, decorated in art deco, with 60 one bedroom units, priced around $400,000. Model units will be ready late in 2006 or early 2007. Homes are expected to start selling in late spring/summer of 2007 and be ready for occupancy in 2008.

Wow. The cars from yet another 625 units pouring out onto Aviation Blvd. Just what I've always wanted.

Note that this information does not yet appear on the William Lyon Homes website. In light of what has happened to the local housing market since April, I wonder if William Lyon is rethinking its plans. Aren't the local homesellers going to just love competing with Lyon and Centex for homebuyers?

With all this high-density housing in the works, which is designed to be more "affordable", it makes me wonder if the bubble is shifting to another asset class, namely the very low end housing market, where people can cram their families into these tiny high-density units. It sort of makes me wonder if this is how slums are born.

L.A. Times: Caught off balance

A major water cooler topic for homeowners these days, according to this October 8, 2006 L.A. Times article by Diane Wedner, is whether our home values are tanking.

USC "experts" state that the decline in the appreciation rate to single digits is "not as rapid" as what happened in the early 1990's. (That sort of contradicts what this earlier article suggested.) What they forecast is a "long grinding slowdown", not a "drop off the cliff." I guess they are making that prediction based on what happened in the early 1990's, when prices sank 17% in six years. (Keeping in mind that that number is very likely a broad measure of Southern California overall, not necessarily what happened in Gardena or Studio City or in your particular neighborhood.

At least we've gotten to the point where the "experts" now expect some price decline! Look how long it's taken them to get to concede that. This is almost like getting an addict to Stage 1 and admit "I have a substance abuse problem." The experts still hang on to this faintest thread of hope by noting that price appreciation is still relatively good in the "less-expensive neighborhoods of Los Angeles." (You know where those are by now, right?) But the Polyannas even concede that the tide is turning there too. Heck, anybody reading the data and charts in this blog could have suggested that!

I suppose it would be too much at this point to read a real estate article in the L.A. Times and not see the obligatory swipe at buyers who decide to wait. As a Cal Poly Pomona economist put it, "Potential buyers are in a waiting mode... their expectations of a tanking market are worse than actual economic conditions." And my reaction to that profound statement is

Huh? Uh, don't buyers + sellers + potential participants determine what the economic conditions are by their decisions to buy or sell or not participate? This statement reminds me of the homeseller who lists a house as "below market value". The seller does not realize that whatever his home sells at is the market value at that point in time, not what he wishes that value to be. The market is what it is. Prices are not sacred and violations of price levels on the downside are not taboo.

But that won't sink in to these experts who want to blame these waiting buyers for the misfortunes of the real estate market.

The Cal Poly Pomona economist differs from the USC expert as to the nature of this slowdown. USC sees it as potentially a long, grinding slowdown, whereas Cal Poly sees the decline as having a potentially a short duration, since interest rates remain low and unemployment is stable. Still, nobody is discussing the idea of the drop-off-the-cliff scenario where prices plunge, as a distinct possibility.

I also have a different take on "why" people engage in real estate transactions. The last paragraph of the article suggests that life will go on nearly as it always has, but if the population at large shifts our economic circumstances (if herd psychology gets majorly bearish), people can always opt to get out of the area and go where conditions have a better chance of improving.

In case you are wondering where the steepest declines by price per square foot were this June-August period, compared YOY, in areas with 50 or more home sales, here they are:

Eagle Rock                   -6.7%
Long Beach Plaza (90808)     -3.9%
Valencia 91355               -3.0%
San Gabriel 91775            -2.5%
La Crescenta                 -2.1%              
Cerritos                     -1.8%

Pacific Palisades, Agoura Hills, Palos Verdes 90274, Westchester, Rowland Heights, Los Altos (90815) ranged from -1.6% to -0.5%. See, you heathens who don't believe in eternal appreciation? The Los Angeles Times thinks those price declines are so insignificant that the article didn't bother breaking them out!

Wednesday, October 04, 2006

Update on 4112 Nataab

I had suspected that the occupants of this house were in some kind of financial trouble because they had only just bought the place in December 2004, and then they employed the "alien" realtor from up north in Antioch, who offered the place for $1.2 million. (It had been purchased in 2004 for $899,000.) Well tonight when I came home from work I noticed the alien realtor sign was gone and in its place a sign from Team Scarborough, still not exactly what I would call the generic brand south bay realtor but their office in Pacific Palisades is close enough. They work in conjunction with Coldwell Banker. I took a brochure but the price was not listed on it. My heart sank. I thought about that old saying, "If you have to ask about the price, you can't afford it." But this was ridiculous!

The MLS listings at Team Scarborough turned up this property. It is listed for $1,049,000. Down 12.5% from the previous fantasmagorical asking price, which I wonder was really just some kind of joke on this neighborhood. It's still a fantasmagorical asking price, in my opinion.

Tuesday, October 03, 2006

More condo conversions, this time in Torrance

We got another brochure in the regular mail, or rather, a large postcard. Pacific Pines condos are located in Torrance. I have to admit, that line "Own in Torrance from the high $200s" really caught my eye. My first impression was that it sounded pretty good. Ha ha! What a sucker I am.

My scepticism set in, and I looked up the address of this complex on the internet. Turns out this was once a luxury apartment complex called Woodbridge.

The lowest end floorplan, The Spruce, has 674 square feet, 1 bed/1 bath. The brochure says from $284,900 but the website says from $274,900 so maybe some of the lowest end units were sold. The Monterey, 2 bed/1 bath, has 864 square feet and starts from $329,900. The Torrey, 2 bed/2 bath, has 924 square feet and starts from $368,900. The Ponderosa, which is the highest end floorplan, is 3 bed/2 bath, has 1137 square feet, and starts from $408,900. Monthly HOA fee ranges from $179 to $216, depending on the floorplan. Amenities such as fitness center, rec center, swimming pools (don't know how big they are), etc.

The gallery of pictures at the Pacific Pines website is very craftfully done. Picture 3 in particular looks like the condo being photographed has tons of room - it is staged very well. Pictures 6 and 12 make you think you are just footsteps to the surf.

I can't help but notice that the Fusion sales team markets its homes for those with an "energetic" lifestyle whereas the Pacific Pines sales team markets its homes for the lounging lifestylers.

It's only been the last month or so that I've become acutely aware of all these former apartments dressed up to be condos.

From the south bay bubble scrapbook

I drive by this 100-unit condo complex almost daily, now that Aviation Blvd is ripped up and unnavigable. Unfortunately this is not one area of Lawndale that has been dolled up in recent years. The picture shows seven For Sale signs but there are actually eight - I've counted them several times. I did not want to photograph this until a new record was reached because I have actually seen clumps of For Sale signs at this complex before in years past - just not this many. If you look hard, you'll see yet another place for sale across the street.

There were flyers available for two of the properties for sale, so I grabbed them. Zillow has gotten way behind guesstimating the value of these units. This is apparently an old building that was converted into condos from apartments, probably the 70's or early 80's. The most recent sale was an 867 square foot 2 bed/2 bath place (about the size of my apartment) in July for $310,000. Zillow guesstimate for that is now $349,135, but we know that's an obsolete valuation. And yes, you read that right, and I did not type the square footage wrong, it is not missing an initial digit 1.

Unit #237, 2 bed/2bath, 939 square feet, is now for sale for $295,000. Unit #135, 0 bed/1 bath (studio), with 371 square feet, is now for sale for $199,000.

Peeking at 90278 listings, I see that inventory is creeping back up. I'm also starting to see markdowns of close to 10%, which used to take 6 months to accomplish, happen in a matter of 2 weeks.

Sunday, October 01, 2006

Fusion condo anyone?

I was wondering if this day would ever occur, or whether the Centex project Fusion at South Bay would sell out so quickly that it would never happen. It looks like the day has arrived. Last week we actually got this brochure in the regular mail:

The one glaring omission from this brochure? Hawthorne. Fusion at South Bay is located in Hawthorne 90250. Hawthorne is not mentioned a single time in this brochure.

I love the line about "morning surf lessons with the kids in Manhattan Beach" as part of the lifestyle Centex is selling. Uh, don't parents work? Don't kids go to school? And then there's back-to-school shopping at a "cool new boutique."

I don't see it published anywhere, but for some reason the number "280" sticks in my head when I think about the number of units being built at Fusion. The tagline for this condo development is, "It takes energy to live in the city." Yep, it's gonna take lots of energy to wrestle your way out into the Aviation Boulevard traffic in the morning, beating the cars from the other 279 units to do so.

There is a 28 unit condo complex three doors down from where we live. Unit #18 was put on the market 09/16/2006. It has 1368 square feet, and was listed at $594K. It was reduced 09/28/2006 to $576K, then again on 09/29/2006 to $558K. 3 bedrooms, 2.5 baths. Sexier zip code (90278) versus 90250, in a condo unit possibly 1/10th the size. The complex has a nice sized pool to boot, too, not just a wading pool for the kiddies. Residence C at Fusion is 2 bedrooms, 2.5 baths, 1208 square feet, and starts at $601,500. Residence D is 2 bed/2 bath, 1331 square feet, and starts from $601K. Access to the same morning surf lessons in Manhattan Beach and the same cool boutique for back-to-school shopping. In spite of my heckling Fusion about their use of the word "energy", I'll assume their floorplans are better than those in the neigboring condos - I have visited the next door condos and the word that comes to mind is "claustrophobia." And it's true that the units near me are over 30 years old. Still, we're talking nearly a 10% price difference here.

Dogmation