Wednesday, June 28, 2006

South Bay Home Inventory Soars - realtor says the "leveling off could take years"

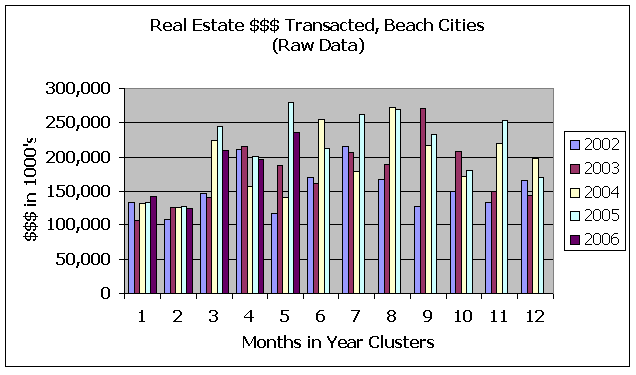
In a June 26 news release, Shorewood Realtors reports that the inventory of south bay homes for sale nearly tripled in May when compared YOY with May 2005. 215 homes were available in May 2005, while 623 homes were available in May 2006.

Not only are the beach cities of El Segundo, Manhattan Beach, Hermosa Beach, and Redondo Beach experiencing a huge jump in inventory. Hawthorne, Lawndale, Torrance, and Inglewood are also experiencing big jumps.

The number of sales in the beach cities is down 27.7% YOY from May 2005. May 2006 saw 164 homes sold, while May 2005 saw 227 homes sold. However, in spite of big inventory jumps, Hawthorne, Inglewood, and Torrance actually experienced increasing sales. Palos Verdes Estates also saw a higher number of sales, though it appears to experience big price swings, due in part to the relatively small number of transactions.

The number of days on market for the four beach cities was 37 days in May 2006 versus 26 days in May 2005.

A related article in the Daily Breeze (June 28: South Bay real estate sellers find fewer, pickier buyers) that quotes Mike Collins of Shorewood reports that the market is "transitioning from a seller's market to a buyer's market", but "we're not there yet". Higher interest rates and "the reluctance of many home buyers to sell their home to trade up" are cited as factors in the market slowdown. "A lot of people... purchased their homes in the last five years who have marvelous loans, great fixed rates for over 30 years... don't want to come out and play... they're happy."

An RE/MAX Beach Cities realtor who is also quoted in the article says, "I've been through a few of these cycles and I would expect this adjustment to last for a while, until prices get real again - however long that takes. I'm thinking years."

For all you bubble psychology watchers, isn't it interesting how these realtors still won't even mention unmentionable words like price decline in their press writeups, when they are fully aware it is inevitable? The politically correct term is now leveling off.

Tuesday, June 27, 2006

USA Today: Housing out of reach in more markets

Be sure to check out this article in the June 27 USA Today. Buyers are still going to "extremes" to buy a home, in some cases with the mortgage, insurance, and property taxes eating up 70% of gross pay.

Here in California, specifically in the Los Angeles-Long Beach-Santa Ana area, the most expensive median-priced home is $563,900, up 179% from Q1 2000. In the San Diego-Carlsbad area, it is $607,300, up 142%. In the Sacramento-Roseville area, it is $376,200, up 183%. In the Riverside-San Bernadino-Ontario area, it is $396,200, up 195%. In the San Francisco-Oakland area, it is $720,400, up 72%. (72%? maybe the dot-com bust affected this area more severely than in other places.) And finally, in the San Jose-Sunnyvale-Santa Clara area, it is $746,800, though figures for appreciation from Q1 2000 were not made available.

In San Diego, the biotech companies down there don't even bother trying to recruit from outside California anymore, because the prospective employees from out of state inevitably get hit with sticker shock.

According to the article, the affordability crisis has pushed millions to distant suburbs, overwhelming transportation infrastructure. A 1 hour commute from Temecula to San Diego five years ago is now 2 1/2 hours. Real quality of life, huh? Between that and what they are shelling out for gas, is it still worth owning a home?

According to the article, as many as 1 out of 3 Americans fear that rising monthly payments (thanks to those creative mortgages) as well as property taxes and energy costs, will force them to sell their homes and buy less expensive ones. Hmm, aren't some people trying to get out from under their properties now for those very reasons, and finding they cannot?

Friday, June 23, 2006

DQNews South Bay Resale Activity for May 2006

According to DQ News, the May Monthly resale activity for the south bay area showed the following:

Zip     # SFR   Median   %Chg   # Condo  Median    %Chg 
        Sales   $SFR      YOY    Sales   $Condo     YOY
90045    40     837,000  11.6      7     450,000    8.7
90245     9     794,000  -6.6      4     530,000   -8.9      
90254    10   1,571,000  19.7     10   1,130,000   45.9   
90260    15     535,000  21.7      5     307,000  -19.2
90266    24   1,202,000 -19.6      5   1,064,000   -8.3
90277    16     873,000 -16.7     20     730,000   13.2     
90278    28     800,000  10.7     38     684,000   -2.7

For the charts below, I tried taking the YOY change in a doubly smooth 3 month moving average of the median SFR prices of each of the beach cities to see if anything interesting shows up. The results are mixed. Overall, price momentum has slowed this year, but for some zip codes the trend is currently flat, for some the trend has just turned up slightly, and for some the trend is currently drifting down, meaning that a trend toward an overall longer term price decline in median prices is not here yet. Since these are sales of existing SFRs, I don't think the resiliency of prices here can be blamed on the upward bias of new construction. The bubble is hanging in there, at least through May 2006.

Note: the charts have a slight insignificant inaccuracy because I do not have available the median price data 3 months prior to June 2003 for calculating moving averages.

2102 Swehtam: Poster child for North Redondo?

If there is any property that is struggling to get sold it's this one. It's unfortunate, because it's located in a tree-lined area of North Redondo, toward the west side (near Manhattan Beach), as opposed to the more questionable east side (Lawndale). Over 2000 square feet, built in 2001, 3 bedrooms, 2+ baths, with a large deck for entertaining.

The first I knew of this property was during Christmas vacation last year (before New Year's), when it was listed for $995,000. It was obviously listed at a price by a realtor who assumed the boom momentum would keep going. It has been relisted at $889,000, then $869,000, and it is now listed at $849,000. That's a 14.6% markdown, which is getting more substantial, as markdowns go. Days on market 180 and counting.

It can be frustrating then downright painful when reality suddenly sets in.

Thursday, June 22, 2006

LA Times: Slowdown could "settle in for a stay" - buyer says he doesn't want "to be the one to overpay"

Southern California bubble watcher Annette Haddad at the LA Times reports in a June 21 story that the home sales slowdown could linger for a while. However, economic and market forecasters, as well as the media, still won't even entertain the idea that a "slowdown" could slip into a "crash", or that it could aggravate the possibility of a severe recession.

The median home price in Southern California in May was only up 6.4% YOY, which is the smallest YOY gain since July 2000. Notice in the article that home prices are still viewed in terms of gains, as in, "how much or how little", not whether home values can actually decline. It'll be interesting to see what the mood is a year from now.

Even the UCLA Anderson School of Business is forecasting "slower growth" for the regional economy, but not a recession.

Realtors say that speculators have vanished, which has taken the edge off the market and caused demand to shrink. They view the market as "more normalized".

Orange County posted the biggest YOY decline in May sales, 31.6%.

Sunday, June 18, 2006

LA Times: Sellers' New Math

An upbeat article in the June 18 LA Times describes how the southern California market has changed and how homes are staying on the market longer now than a year ago.

Although the article mentions that DOM (days on market) numbers have increased substantially, it does not mention how days on market statistics can be skewed when homes are re-re-re-listed at progressively lower prices. So DOM by this time could be significantly more than what the realtor groups are "officially" reporting. (As a side note: the realtor on whom I depend for DOM stats in the South Bay area did not issue a report for May, which makes me go - hmmmmm.)

There is still no sign of concern or panic. "The market is normalizing", one realtor says, which is "quite refreshing". Buyers are no longer panicking, chirps this same realtor. Many sellers are still refusing to lower their asking prices because they "must" get a certain return. One seller complained that he almost had a deal closed, but the buyer felt, "We're coming into summer, let's hold out." Still another buyer says he "doesn't feel insulted" that it took more than 120 days to sell his home "there are several houses that have been on the market quite a bit longer than ours."

Folks, do you still sense just a touch of arrogance here? The tone of the article makes it sound like sellers still in most cases think they are in the driver's seat, they just have to expect to wait longer to get their properties sold. Shaving 5% or 10% off their asking prices is tolerable, while knocking more off is unthinkable. Unlike San Diego, median prices have not gone flat or declined YOY.

However, whatever hits the newspaper is a rear-view mirror look at current market conditions. How many buyers out there right now are thinking "Well gee, what's the hurry, let's hold out!" ???

Thursday, June 15, 2006

June activity notes

Sales activity in the 90278 area looks like it is way down when compared to last year. We'll have to keep watching to see if the malaise is here for good. It is not clear if we are passing the "normal market" phase into the "sick phase", but we're watching.

My favorite realtor source has not published a June report for the Redondo area. Maybe he is on vacation, or maybe, the numbers are really bad and a decision was made not to publish them. Dunno.

There is now a more substantial handful of "repeat offenders", listings that expire and then get relisted.

3191 Setag was listed early this year at $1,198,000. It expired and now is relisted at $1,099,000, a reduction of over 8%, still not what I would consider a very serious reduction.

3391 Swehtam was listed early this year at $889,000 and is now listed at $819,000, a reduction of 7.8%.

3032 Mossolb is a new bubbleminium that has been on the market at least since early this year, and its asking price of $1,299,900 has not changed at all.

The earliest I knew about 2500 Nosnibor being on the market was late last October. At the time the asking price was $1,290,000. It was re-re-relisted June 13 at $1,149,000, a reduction of over 10%.

Tuesday, June 06, 2006

Is inventory rising quickly in your area?

I was chatting about the real estate bubble with two friends at work today, both residents of 90064, showing them my charts, and they've commented about how they've suddenly been seeing more properties for sale, say, in the last 2-3 weeks. A "beach cities" query (90245, 90254, 90266, 90277, 90278) on Zip Realty has shown me that inventory is up around 18% in the last 2-3 weeks.

The rise in inventory is due in part to school ending and people wanting to relocate their families over the summer. But the big question is, will there be enough buyer demand to keep the market enjoying "healthy appreciation", as realtors like to put it?

(I'm not sure what "unhealthy appreciation" is.)

Have you been seeing explosive inventory growth in your zip codes?

Sunday, June 04, 2006

Shorewood Report from May 26, 2006

We've seen that days on market, even though it is a highly manipulatable statistic, nevertheless has risen significantly here in the south bay, a major clue that the housing market's boom trend of recent years has changed.

Another major statistic is inventory level, which is the subject of this Shorewood report from May 26. During April, home inventory for the beach cities of El Segundo, Manhattan Beach, Hermosa Beach, and Redondo Beach was 536, up 126% from April 2005. That is also a good indication that the area's housing market boom trend has changed.

The number of homes sold in the beach cities for April was 172, down 15.3% from April 2005, still another indication that market's boom trend has changed.

Friday, June 02, 2006

Real Estate $$$ Transacted Through May 2006 for Beach Cities

It's the affordability issue. Many areas here in and around the beach cities are in a bit of a slump, but the pin that will burst this real estate bubble has not definitively shown up. Real estate markets in areas that are good but still affordable (relatively speaking) are continuing to do well overall.

Whatever they're selling in Playa Vista (90094) has been going like hotcakes on steroids, however the YOY trend is headed down. Torrance, especially 90502, is doing well, with some zip codes making up for weakness in March and April. 90502 trend is still strongly up. Lawndale (90260) is hanging in there.

Manhattan Beach (90266) is showing a bit of a slowdown but still hanging in there. South Redondo Beach (90277) started softening in March. North Redondo (90278) had a decent April but otherwise has been soft all year.

Further north, Culver City (90230 and 90232) still seems to be hanging on, bouncing back a bit from a soft March and April. Rancho Park (90064) has been showing a steady downward slump since January.

The zip codes that are have stayed above the 0% line in the YOY graphs for most of 2006 are: 90045, 90094, 90230 (now just touching 0%), 90245 (broke back up over the 0% line but now heading back down), 90260, 90266, 90501, and 90502.

Real estate conditions are hanging in there, almost through clenched teeth. However, we do not expect this to last. If you have checked global financial markets lately, you'll know that they've been undergoing a deflationary meltdown, which in due time will probably hit here. Even some commodities have been taken out back to the woodshed and gotten smacked. The yield curve is inverting again, for the second time in less than a year. The financial clowns that run this country argue that this is a "conundrum" due to a "global savings glut" when the truth is that an inverted yield curve has been a classic predictor of a recession.

Be sure to visit the Beartopia Real Estate $$$ Tracker for an explanation of the data on these charts, and for charts for specific zip codes. You certainly won't be seeing anything like these charts in your local papers.

Dogmation