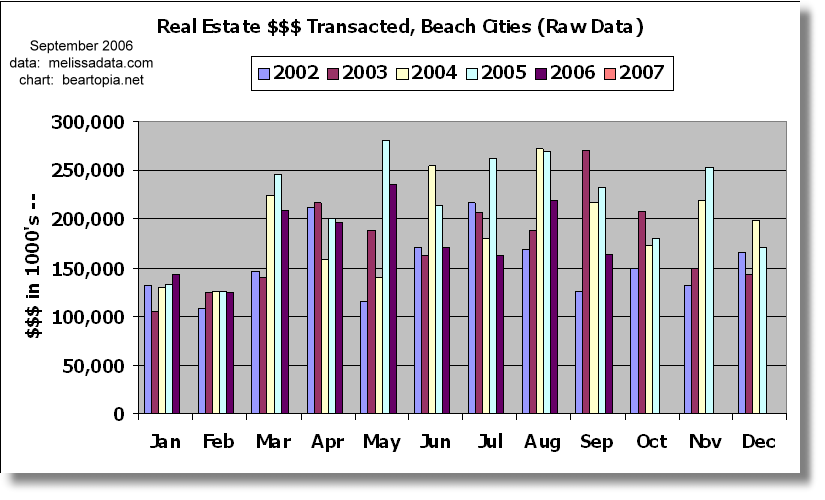
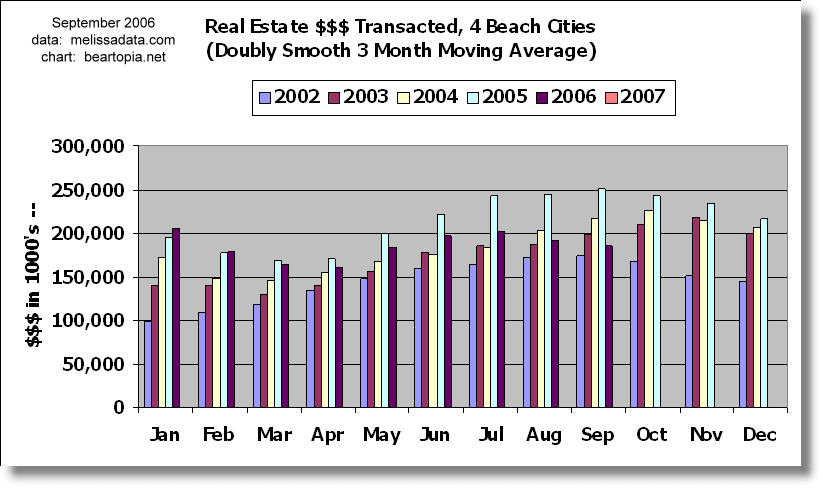
Real Estate $$$ Transacted through September 2006 for Beach Cities
The September "bounce" in sales looks like it fizzled out. The slowdown we've been seeing in the beach cities continues in earnest. It's amazing to think that, on a YOY basis on the moving average, dollar volume in Hermosa Beach is down 50% and dollar volume in Redondo Beach is down 33%. It must be getting quite tough to sell a house in these areas. Look at the Beach Cities charts at the bottom of this post and notice that YOY line continuing its downward trek. And even some of the surrounding areas that have remained strong are now starting to exhibit softening.
I am trying to expand (and limit) my coverage in these monthly charts to the area west of the 110 freeway and south of the 10 freeway. However there are a few zip codes with data that looks way too wacky to chart. The zip codes I am excluding for this reason, are, to the best of my knowledge: 90710, 90231, 90247, and 90274. (I am pretty tired right now, so I may have excluded more, I just can't locate them at the moment.)
You can access individual zip code charts here. You can also try our Google Maps tool but I have not had time to update it with all the additional areas I am covering yet. It also seems very slow at times.
I've spotted a few data errors in 90094 and in some of the worksheets in which zip codes are combined. Fortunately the errors have not affected the beach cities combined, our main focus here.
Keep in mind that these charts for September don't "officially" cover all of September. I did them on September 30, on a day when there were probably more sales that are not yet tabulated. Also, I noticed in the Melissa Data this weekend that on occasion prior months get updated. I try to catch those adjustments when I spot them. Those minor deviances don't change the overall trend we are witnessing.
Also, it's a good idea to keep in mind that just because a YOY line dips below 0% in a chart it doesn't necessarily spell disaster for the particular zip code represented in that chart. Data and derived trends have to be taken in context. Perhaps the previous year was an exceptional year in a particular area because a slew of new homes came on the market and there was no new offering in the current year. Look at the YOY charts and you will see numerous times when a trendline has dipped below 0% but then bounced back. I think, however, that when one takes into consideration recent economic data, such as our recent inverted yield curve and a very weak Philadelphia Manufacturing Index, and the impact of creative mortgage financing, then that dip below 0% becomes more meaningful. The longer it stays below 0% and the further away it moves below 0%, the more ominous it could be.
The numbers in the lists below are the September YOY percentages on a doubly smooth moving average. The lists contain some added zip codes that are outside my intended reporting area, just so there is more to compare. I went and made up charts for those zip codes, but just haven't uploaded them. Notice that some of these surrounding areas are still doing quite well on a relative basis, though there are signs that the steroids are starting to wear off.
Real estate on steroids:90305 352.1% Inglewood 90094 70.1% Playa Vista 90301-90305 36.5% Inglewood/Lennox combined 90304 31.8% Lennox 90245 27.6% El Segundo 90746 27.5% Carson 90062 23.9% South CentralDoing very well:
90043 17.5% Hyde Park, Windsor Hills
90047 11.0% South Central
90744 10.5% Wilmington
90301 9.3% Inglewood
90037 8.7% South Central
90260 7.3% Lawndale
90502 5.7% Torrance
90745 5.7% Carson
Hanging in there:
90504 1.9% Torrance
90303 0.9% Inglewood
90302 0.8% Inglewood
Slip sliding away:
90018 -2.1% Jefferson Park
90250 -2.9% Hawthorne
90016 -5.1% West Adams
90044 -5.1% Athens
90501 -7.0% Torrance
Losing a grip:
90230 -11.2% Culver City
90501-90505 -11.3% Torrance Combined
90045 -11.3% Westchester
90266 -14.3% Manhattan Beach
90249 -16.9% Gardena
90035 -17.0% West Fairfax
90505 -19.0% Torrance
About to go over a cliff?
90503 -25.0% Torrance
90066 -25.1% Mar Vista
90036 -25.6% Park La Brea
90019 -26.1% Country Club Park/Mid City
beach cities -26.3% 4 Beach Cities combined
90008 -27.8% Baldwin Hills / Leimart Park
90717 -30.7% Lomita
90007 -30.8% South Central
90292 -31.9% Marina del Rey
90278 -32.2% Redondo Beach (north)
90277-90278 -33.3% Redondo Beach combined
90277 -34.8% Redondo Beach (south)
90034 -36.7% Palms
90291 -36.9% Venice
90732 -37.8% San Pedro/Rancho PV
90232 -38.7% Culver City
90056 -41.2% Ladera Heights
90275 -43.7% Palos Verdes Estates
90293 -43.9% Playa del Rey
90064 -47.2% Rancho Park/Cheviot Hills
90401-90405 -47.7% Santa Monica combined
90254 -49.5% Hermosa Beach
With all the technical weakness we've charted here in this blog, it's pretty amazing that we haven't yet seen headlines about prices collapsing.
Here is the August link for comparison:
Compare to August, 2006.And here are the Beach Cities (90245, 90254, 90266, 90277, 90278) charts:

posted by bearmaster at 10:12 PM
![]()
![]()


2 Comments:
For the time being El Segundo is the only one of the beach cities holding up. The current YOY number for the beach cities is -26.3%, which is bad enough - I wonder how much worse it would be if El Segundo were also flat to down.
I have updated the Google Maps tool with 90732, 90044, and 90047 zip code boundaries.
Post a Comment
<< Home