Real Estate $$$ Transacted through October 2006
Since I'm putting this data out early, there is always the chance that this last weekend in October could be a magnificent real estate sale weekend which I have not captured. As I normally do, I will roll forward any adjustments that need to be made and include any October fixes that need to be made when I publish the November charts.
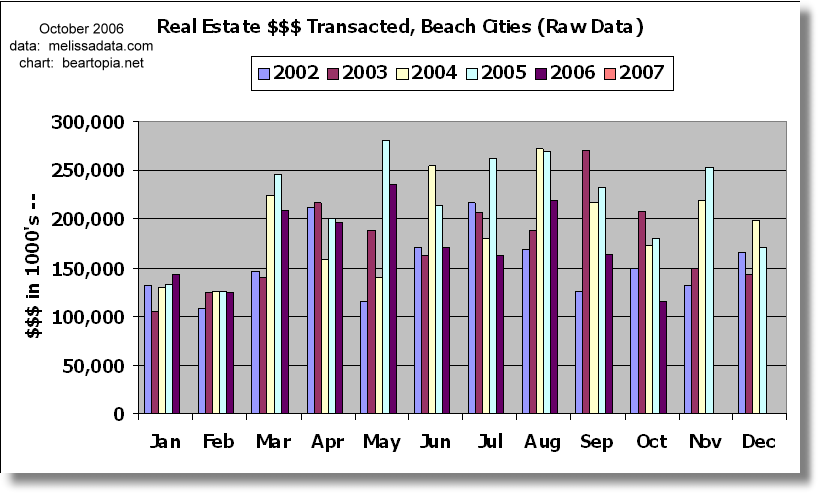
If you are new to this blog, be sure to read an explanation of these charts at the Beartopia real estate $$$ tracker. It is important to keep in mind that these are not price charts. Individual zip code charts can also be viewed from our Google Maps tool.
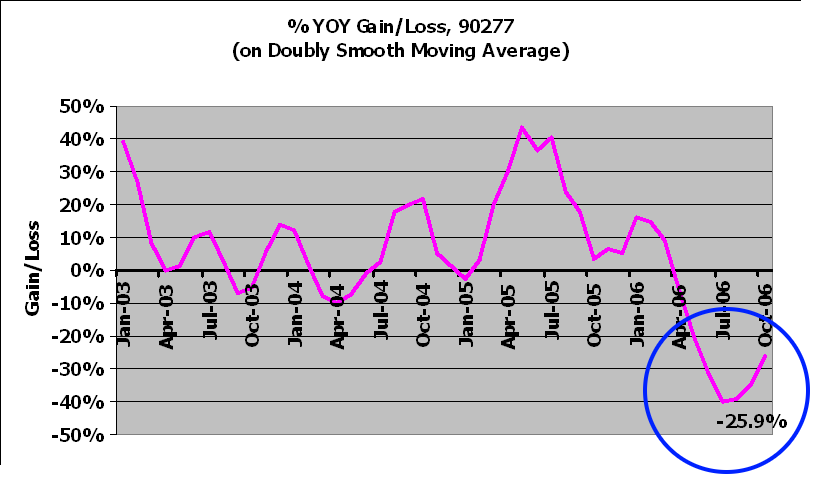
If the real estate market is supposed to have bottomed, I've seen very little evidence supporting that contention. The one "big" bounce I noticed was in 90277 (South Redondo), which went from a -35% YOY decline in $$$ transaction volume to a -26% YOY decline. Is that what the fuss was all about?
The one thing I noticed I kept doing while preparing these charts was that I had to keep adjusting the vertical axis on the left of the YOY charts to allow for more downward (negative) trend to develop.
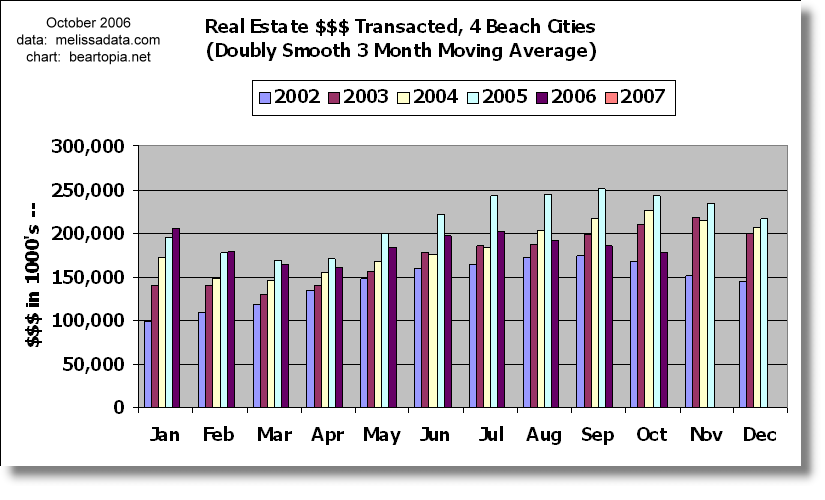
In spite of that bounce in 90277 and still some strength in 90245 (El Segundo), the four beach cities have continued their downtrend, though at a slower pace. The beach cities are comprised of El Segundo, Hermosa Beach (90254), Manhattan Beach (90266), and Redondo Beach (90277 and 90278). On the YOY chart you can see that the rate of decline has slowed down a bit.

The more affordable areas that have been holdouts are also weakening. In the rankings for the area below, you can see that compared to last month, there are fewer zip codes in positive territory, and more areas are falling into negative territory. My groupings (and their labelings) are somewhat arbitrary. Keep in mind that all I did was take sorted output and place it in this post. There are individual zip codes in this list that may not necessarily "deserve" their ranking. If a market has been on steroids, coming down -22% from a YOY rate of , say, 800% is still a good sales pace! Take a look at the raw and moving average charts for an individual zip code to get a sense of its history before drawing any conclusions.
Real estate on steroids (realtors fat and happy):90305 273.1% Inglewood 90301-90305 33.2% Inglewood/Lennox combined 90746 28.6% Carson 90304 24.6% Lennox 90245 22.1% El SegundoDoing very well:
90043 19.0% Hyde Park, Windsor Hills
90037 11.6% South Central
90744 8.2% Wilmington
90062 7.8% South Central
Hanging in there:
90303 3.5% Inglewood
90047 3.4% South Central
90301 3.3% Inglewood
90260 2.4% Lawndale
Slip sliding away:
90302 -6.0% Inglewood
90044 -6.1% Athens
90745 -6.2% Carson
90502 -8.5% Torrance
90250 -8.6% Hawthorne
Losing a grip:
90018 -11.2% Jefferson Park
90501 -14.4% Torrance
90504 -14.6% Torrance
90266 -15.6% Manhattan Beach
90016 -18.3% West Adams
90230 -19.1% Culver City
90045 -20.0% Westchester
90094 -22.0% Playa Vista
90501-90505 -23.0% Torrance Combined
90249 -24.2% Gardena
About to go over a cliff (realtors getting hungry):
90277 -25.9% Redondo Beach (south)
90066 -26.7% Mar Vista
beach cities -27.1% 4 Beach Cities combined
90035 -29.2% West Fairfax
90019 -29.6% Country Club Park/Mid City
90036 -31.0% Park La Brea
90008 -31.4% Baldwin Hills / Leimart Park
90007 -32.5% South Central
90277-90278 -33.0% Redondo Beach combined
90505 -33.6% Torrance
90232 -33.7% Culver City
90503 -33.7% Torrance
90717 -37.3% Lomita
90278 -37.6% Redondo Beach (north)
90034 -37.8% Palms
90732 -41.8% San Pedro/Rancho PV
90291 -42.3% Venice
90293 -42.5% Playa del Rey
90056 -43.1% Ladera Heights
90292 -44.3% Marina del Rey
90254 -48.8% Hermosa Beach
90064 -49.7% Rancho Park/Cheviot Hills
Sliding down the cliff (realtors really hungry!):
90401-90405 -55.7% Santa Monica combined
90275 -65.7% Palos Verdes Estates
One thing I am now seeing in my own zip code (90278) is inventory starting to drop a little again. It was up in September, then dropped, then crept back up again, then this last week or so started dropping again. It could be an uptick in sales. Or it could be listings expiring. Time will tell. But for now, when combined with my other measures of activity and with the trends I am tracking in median prices, I find it impossible to believe that this market has bottomed and the deterioration we've seen will be repaired anytime soon, no matter how much hot air is blown by Greenspan and others.
By the way, an October 29 L.A. Times story by Diane Wedner titled "Not an agent's market either" discusses what we have been suspecting - this is becoming an extremely tough business for realtors to be in, and some are leaving the industry or taking on other jobs. According to data in the story, about 85% of sales are transacted by 15% of realtors. With a shrinking real estate $$$ pie, that doesn't leave much to go around to the remaining 85% of agents.
posted by bearmaster at 7:26 PM
![]()
![]()


0 Comments:
Post a Comment
<< Home