Other measures of Beach Cities market activity, September 2006
(Sorry this was not originally posted at the time originally promised. Shorewood suffered a glitch getting their data from a third party.)
If you're a South Bay housing bear, don't let all the media hype about a bottom in the housing market fool you. Shorewood Realtors is now reporting a decline in the median house price for the beach cities of El Segundo, Hermosa Beach, Manhattan Beach, and Redondo Beach, although it's not called a decline; the news release just states that the price is "edging downward." So psychologically, we've reached a point where it's acceptable to say that sales are declining, because that is stating the glaringly and painfully obvious, but since prices are just barely off their year-ago levels, they are only "edging downward."
Can't you just feel how much hope is still built into this market? When we say that prices are "edging downward", it almost sounds like prices are easily reversible, doesn't it? Can't you just picture prices dipping their toes in the water of a pool, deciding it is too cold, then stepping back from that scary edge? Prices are merely standing with toes to the edge - they haven't fallen over a cliff - all they have to do is step back. Oh, if only it were that simple.
DOM is not showing much change. I have been very unsatisfied with the DOM data available to me so I'm hoping that the data I'm collecting will reveal a more truthful DOM in four or five months time. We've gotten to the point where DOM is now severely affected because inventories are growing like crazy, and so many houses are now getting listed multiple times. But in spite of these problems, the DOM is at least not showing any significant reversal. Even with expired listings and relistings, the DOM is meandering flat to upward.

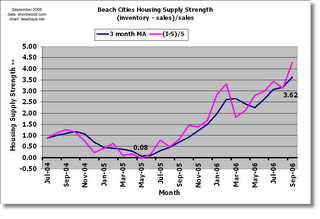
My own Housing Supply Strength (aka Demand Weakness) is telling a more dramatic story though. This measure is my own device, where I simply take (inventory-sales)/sales, or (I-S)/S and plot both it and its moving average. If inventory equalled sales, the graph would touch 0, which it did indeed do in late spring 2005. If there were no sales, the graph would trend to infinity. If this measure is of any value, then spring 2005 was officially "the market top" for the beach cities. The moving average has now pushed up to 3.62.
The only problem I have with it is that the data does not go back far enough to a market that the experienced oldtimer realtors would call "normal." So I don't know what number I would expect to see on this graph that equates to a normal market. Many realtors are calling this current market now a return to more normal conditions, so maybe 3.62 is very normal.


5 Comments:
for me "normal market conditions" also take affordability into account. i don't think of price/income ratios of 7+ to be anywhere near normal.
Good point. CAR has reengineered their affordability index. I don't know if it can be reverse engineered to define "affordability".
Affordability?
Yea right...
www.demographia.com/dhi-ix2005q3.pdf
I did a little post on this on my blog. Basically, go straight to figure 7 on page 14. That shows what the market will return to at the end of 7 years (in my opinion).
Neil
I like the last chart. Even if 3.6 is normal, the trend line is strong and not levelling out yet.
I went to a couple open houses in Manhattan Beach this weekend. One was asking 1.3mil and the place was underwhelming to say the least. The rooms were soooo small. I looked it up on Zillow. Bought almost 3 yrs ago exactly for $875K. IMO, They'll be luck get they can get 1 mil.
Post a Comment
<< Home