Other measures of Beach Cities market activity, August 2006
Shorewood Realtors report south bay home prices as demonstrating continued "resilience". Will prices "flatten" in a much-hyped "soft landing" that we hear about ad nauseum? Or will they decline? Lets take a look at our internal measures of market strength.
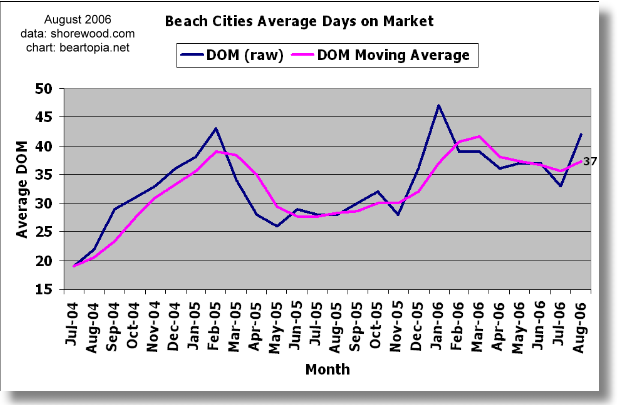
Days on market (DOM) is a measure known to be a bit deceptive, since it does not account for listings pulled off the market because the sellers could not get the offers they wanted. Also, when a home is relisted after its previous listing expires, the clock starts at 0 again, so DOM does not take that into consideration either. (Anecdotally, I am aware of homes in my neighborhood that have been listed many months.) In spite of these drawbacks, we see DOM starting to creep up here. The DOM numbers are found in the Shorewood reports.
For the month of August, my supply strength (AKA demand weakness) ratio has reduced very slightly. The moving average still edged up, though at a slower rate than in prior months. The August reduction can be expected for a few reasons. One - after a horrible July, any real estate activity prior to school starting is bound to look better on a relative basis. Two - inventory can also reduce when listings expire unsold or sellers pull their homes off the market because they can't get asking prices and they refuse to lower their prices.

Overall, this is no recovery to speak of. A great deal of technical damage has been done which would take a while to reverse.
For those of you not familiar with my Housing Supply Strength (Demand Weakness), it is simply (inventory-sales)/sales for the four major beach cities (El Segundo, Hermosa Beach, Manhattan Beach, Redondo Beach) according to the Shorewood data. In a market where the number of homes sold is about equal to inventory of homes available, this number would be close to 0, as it was around May-June 2005. I call that time period the market peak for this area. Since that time, (I-S)/S has been climbing, which I interpret as steadily weakening demand, or increasing supply strength, to be politically correct, which realtors translate as "more homes to choose from".
Hopefully I'll get September $$$ transaction charts posted next weekend.
posted by bearmaster at 9:46 PM
![]()
![]()


3 Comments:
Thought you'd be interested in the surging average days on market (DOM below) for Santa Monica SFRs less than $3 million. Unlike the MLS, this tracks individual addresses through re-listings.
4/21/06 -- 35 available
6/2/06 -- 56
6/30/06 -- 66 -- 49 DOM
8/4/06 -- 70 -- 50 DOM
9/1/06 -- 71 -- 59 DOM
9/24/06 -- 81 -- 70 DOM
Thanks for posting this! I suspect the "real" beach cities DOM is moving higher in a more dramatic fashion like this.
Bearmaster,
Thanks again for the great data. Charting really helps show the trends.
I'm predicting this month (September 2006) will be the last strong selling month for a while.
Personally, the inventory present on the market at this time of year... is amazing. :)
Neil
Post a Comment
<< Home