Tuesday, December 26, 2006

2102 Swehtam hits the one year mark; rental bubble in its early stages

As suggested by one blog reader, maybe we ought to start sending cakes out to these property owners when they've hit the one year anniversary milestone for having their property listed without a sale. So on that note, a one year Humpty Dumpty cake goes to 2102 Swetham unit C (back unit).

I discovered this property for sale a year ago when I was on Christmas vacation from work, and I went back and visited it again during my current Christmas vacation. I photographed it again but except for a few plants and a different listing agent hanging from the yardarm, it looks exactly the same:

(Long time blog readers know that I don't like to post the full real address of a property in order to protect the guilty, so I scramble the address.)

A year ago the asking price was $995,000. It has been listed at $789,000 for several months now, so it is obviously waaayyy overdue for yet another price reduction.

Soon to hit the one-year mark is 3032 Mossolb. It's been listed as least since February. Originally listed at $1,299,000, it has been "reduced" to $1,200,000. Today while driving by I noticed it appears the builder has thrown in the towel and decided to rent it out. Now I am wondering, is somebody who is so unwilling to cut his asking price when trying to sell a property still going to have a clear view of the rental market, and set his rental asking price by what reality dictates or by what fantasy dictates? And the second question preying on my brain is, with a rental sign in the window, and a For Sale sign in the yard, with a reduction banner affixed to it, why would any renter in his right mind want to fork over his firstborn in asking rent, when the owner so clearly wants to sell the property, thereby displacing and inconveniencing the renter and forcing him to move again? And the third thought haunting me, for which I sincerely hope the answer is an overwhelming NO, is - are there really morons out there who would hand over their firstborns just for the privilege of renting here? (Sigh.)

This rental is just a few blocks away on Nelson.

I repeat - with the neighborhood being pretty much the same in these two spots, WHO would pay $4800 a month rent, when a comparable property just a couple of blocks away on Nelson may rent for at least 33% less?!?

And finally, we have 4012 Llerraf. I am not sure this rental is for Unit A or Unit B. Unit B is currently listed for sale at $1,049,000 in Zip Realty, but there is no obvious For Sale sign visible from the street.

Rental prices have exploded upwards within the last year, accounting for the jumps in CPI and perceived inflation threat the Federal Reserve loves to talk about. In spite of this, I've held the opinion that the rental market in this area will eventually start to feel some pressure, just like the sales market. The number of rental listings in my neighborhood is growing by leaps and bounds, so a partial answer to a question I've asked earlier this year about what happens to these unresolved sale listings is that, increasingly, it looks like the owner tries to rent the property out. But since so many owners are still in such denial, I seriously doubt their asking prices for rent will be any more realistic than their asking prices for sale. Will these For Rent signs just end up as lawn decoration or will they bring in any money to slow the cash bleeding?

In my opinion, ALL of these are fantasy rental asking prices, and between them and the asking prices on properties for sale, it will just compel habitat seekers to flee and look elsewhere all the faster.

Ugh what a mess. This housing market is the ultimate chaotic feedback system, if ever there was one.

Sunday, December 24, 2006

"...San Diego, Del Mar, Azusa, Redlands, Riverside, Pasadena, anywhere brought fabulous prices...and the boom ended...in utter collapse..."

This December 6, 2006 article by Fred Sheehan called "A Brief, Superficial, and Arbitrary History of Property-Price Collapses" uses Los Angeles and Southern California as illustrations. The title of this post was quoted from David Starr Jordan, writing about a severe So Cal real estate bust in 1887 and 1888, despite a decade in which the population was doubling. Sheehan also looks at data from other historians and argues how the argument that demographics supports real estate prices is flawed. I admit it's difficult to verify the author's statement that nominal residential property prices in some part of the country have never recovered after the 1920's-1930's collapse. But do take note of what Sir John Templeton says at the end of the article.

The Anderson Forecast team at UCLA might restore one’s hope that academic economists 
fulfill a productive function. Having disparaged the California housing boom through 
its ascent, a springtime presentation by one of its economists predicted the swoon 
that has come to pass. Alas, he stumbled. Asked if a real estate crash was in store, 
he reverted to form: Southern California is in no way comparable to such one-industry 
towns as Houston, and besides, California had never suffered a real estate meltdown. 
On the first point, with 2% of adults in California now proudly waving real estate 
licenses to sell, houses to California today may be as dominant a force as oil to 
Houston in the 1980s. On the second point, one of the worst real estate debacles in 
the history of the United States occurred on the ground where he stood.

More important than the misleading history lesson is the foregone opportunity to 
profit. The banking system today is a far more reckless operation than during earlier 
periods. This offers investment options.   

Maybe the professor’s own education is lacking. For all the data spilling forth that 
quantify current property trends (e.g., house sales, inventory, borrowing rates), 
reference to past price changes is lacking. Unlike historical data on stock and bond 
market peaks and valleys, the history of housing swoons lies entombed in the dark. 
The information is difficult to collect, if it was ever collected at all. Therefore, 
such formulations as “the stock market fell an average of x% during past market 
breaks” do not exist. Yet, to ignore what we do know leaves us without any reference 
when economists make off-the-cuff predictions with no fear of contradiction.

A recent example by America’s most successful mortgage broker was par for the guild 
and for the man. On October 26, former Federal Reserve Chairman Alan Greenspan 
mumbled that the housing slump is “likely past.” Exactly one week later, this 
unsubstantiated opinion was expertly choreographed into a National Association of 
Realtors $40-million-advertising campaign with full-page newspaper ads: “It’s a Great 
Time to Buy or Sell a House.” According to the upper-right-hand quadrant of the 
newsprint layout, the man who told the nation “a traditional fixed-rate mortgage 
might be an expensive method of financing a loan” in February 2004, only to raise 
rates two months later, assures us now that the fourth quarter (of 2006) will 
“certainly be better than the third quarter.”

Alan Greenspan has always been wrong when it mattered. But that’s enough of him. What 
follows is a brief, superficial, and arbitrary history of property-price collapses in 
the United States. It is true any tenured economist would toss this summary into the 
dustbin – only data worthy of correlation and regression analyses are worth knowing. 
(Charles Kindleberger’s Manias, Panics and Crashes is chock full of property-crash 
prices, but the late and great economist was his own man.) The intention of this 
exposition is to annotate the broad generality that real estate prices never fall. 
When Houston in the 1980s and Southern California in the 1990s are mentioned, these 
tempests are qualified as local market quandaries. This is both selective (only 
post-World-War II need apply) and faulty (the national price level dropped in 1964). 
And besides, since most local markets across the country are falling now, parochial 
dips in the past are worth visiting. Alas, the broad generality is what most everyone 
knows and the National Association of Realtors should be congratulated for succeeding 
so thoroughly in its marketing campaign.

In one sense, the post-War fixation is proper: the Federal Reserve’s money printing 
press is greased and oiled to ward off a collapse in prices today. Yet, to save the 
housing market by inflating credit is a remedy for a specific problem that would 
cause a general epidemic. The Fed has no control over the direction of credit flows. 
Should the current rate of credit growth spill into consumer prices, $50 hamburgers 
will create a bull market in Ramen Pride. It is doubtful the unnerving private equity 
flows today would exist if not for current Fed efforts to resurrect the moribund 
housing market. If the authorities accelerate this vain effort, the credit inflation 
will chase things and Spam will be served for Thanksgiving dinner.

Should the Fed either resist the temptation to hyperinflate, or find itself incapable 
of doing so, the current housing market will fall into a much longer history of 
bubbles. Here, the most important recurring characteristic is the propellant for all 
such bubbles: credit. The recent mania was no different: it was not a housing feast 
but an indulgence of mortgages.

A protracted exposition on California is explored for the benefit of haphazardly 
tutored students at UCLA. Florida is next in line followed by some quick flybys of 
other mortgage manias.

The population of Los Angeles rose from 10,000 in 1880 to 50,000 in 1890 and 100,000 
in 1900. Yet, a severe real estate bust wiped out most of the wealth in 1887 and 
1888.  David Starr Jordan described the boom and bust in California and the 
Californians: “[A]lmost every bluff along the coast, from Los Angeles to San Diego 
and beyond was staked out in town lots.” He continued: “Every resident bought lots, 
all the lots he could hold. The tourist took his hand in speculation. Corner lots in 
San Diego, Del Mar, Azusa, Redlands, Riverside, Pasadena, anywhere brought fabulous 
prices. A village was laid out in the uninhabited bed of a mountain torrent, and men 
stood in the streets in Los Angeles… all night long, to wait their turn in buying 
lots. Land, worthless and inaccessible, barren cliffs' river-wash, sand hills, cactus 
deserts' sinks of alkali, everything met with ready sale. The belief that Southern 
California would be one great city was universal. The desire to buy became a mania. 
‘Millionaires of a day,’ even the shrewdest lost their heads, and the boom ended, as 
such booms always end in utter collapse.”

Of course, those “Visionaries” who believed Southern California would be “one great 
city” were correct. This was an impressive long-sighted prediction (and, we can be 
sure, also promoters’ attempts to entice more fish to the lure), yet, “even the 
shrewdest” lost their shirts. Those today who harp on “housing shortages” and the 
demographic needs of a growing population should consider a city that went broke 
during a decade of 500% incremental growth.

In 2006, “utter collapse” looks remote. It is difficult to imagine. It is drummed in 
to us that the Fed would never permit another mass default such as occurred in the 
1930s. So we turn to the 1890 account of T. S. Van Dyke, author of Millionaires for a 
Day, who writes in terms a Californian might find enriching today, given the loan 
markdowns – and tight credit – sure to beset the more aggressive local lenders: "The 
money market tightened almost on the instant. From every quarter of the land the 
drain of money outward had been enormous, and had been balanced only by the immense 
amount constantly coming in. Almost from the day this inflow ceased money seemed 
scarce everywhere, for the outgo still continued. Not only were vast sums going out 
every day for water-pipe, railroad iron, cement, lumber, and other material for the 
great improvements going on in every direction, most of which material had already 
been ordered, but thousands more were still going out for diamonds and a host of 
other things already bought – things that only increase the general indebtedness of 
community by making those who cannot afford them imitate those who can. And tens of 
thousands more were going out for butter, eggs, pork, and even potatoes and other 
vegetables, which the luxurious boomers thought it beneath the dignity of 
millionaires to raise."

Van Dyke’s paragraph addresses a handful of parallel booms and busts that accompany 
any and all property credit booms and busts. These might be considered by the reader. 
Of a more specific nature, we do know the population in Los Angeles proper was 
supplemented by at least 200,000 transients in 1887. (Living in tents, they used the 
post office for mail delivery.) We know that over 40% of houses bought nationwide in 
2005 were for speculation or second (or third, or fourth) homes. (The Internet 
rendered the pup tent unnecessary, making it possible to buy blocks of houses without 
missing one’s favorite sitcom.) Price levels are hard to come by; the momentum of 
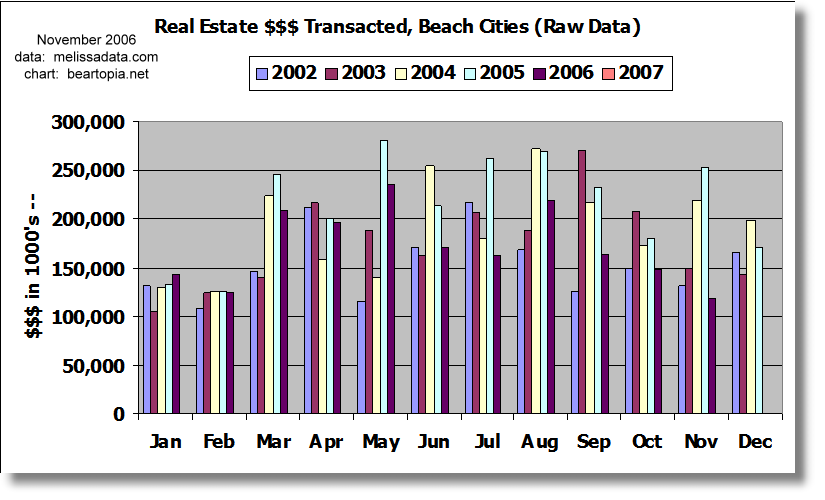
day-traders is easier to track. We also know that the value of real estate 
transactions in Los Angeles County exceeded $2 million for the first time in May 
1886, passed $5 million in January 1887, $10 million in June 1887, $12 million in 
July 1887, fell below $5 million in December 1887 and slid under $3 million in 
November 1888. (The figures look small but it is the change in proportions that 
matter. There was no Federal Reserve in those days to print and inflate the money 
supply as it wished – the reader might feel more at home by replacing “million” with 
“trillion.”) 

Of greater immediate importance for those considering a short or put position against 
California lenders, is the comparative recklessness of banks today. In The Boom of 
the Eighties, Glenn S. Dumke found that banks became more conservative as the boom 
reached its peak. “In 1885 loans amounted to 80% of deposits; in January 1887, to 62 
½ per cent…. By July of 1887, less than half of the banks’ funds were on loan, and 
six months thereafter only one quarter.” There were a couple of minor bank runs; the 
banking system stood rock solid after the crash. All this, and without the 500 Ph.D. 
economists on the Federal Reserve staff whose models have proved housing bubbles are 
either inconsequential or cannot exist.

The Florida land mania of the 1920s offers another potentially fruitful comparison 
for the contemporary investor – then, too, banks were tightwads compared to the 
profit-mad lenders of today. Promoters descended on the state. Restaurants and delis 
served lines of speculators coffee for 75 cents (with no cream) when the going price 
for a cup in New York City was a nickel. In the summer of 1925, residents of Miami 
placed “Not for Sale” signs to ward off the pests. Leases to realtors reached $700 a 
square foot in Miami, when similar space at Broadway and 42nd Street in New York – a 
very desirable location – rented for $13 a square foot. Even today, the top 
commercial property rents in the world, in Hong Kong and London, top out at around 
$250 and $220 a square foot, respectively.  

The momentum traders in Miami, tracked by real estate transfers, increased volume 
from 4,126 in January 1924 to 9,744 in January 1925 to 16,960 in October 1925 to 
4,491 a year later. By March 10, 1926, it was reported that scores of small real 
estate offices had been closed “overnight.” Miami real estate bond houses took 
advantage of a stock market break in that same month. They waged a full-page ad 
campaign: “How Wall Street Lost $4 Billion: and how you can forever escape such 
losses.” It seems safe to say the credulous readers of National Association of 
Realtors propaganda today will be just as dissatisfied as the followers of Miami bond 
touts 80 years ago.

Price depreciations are anecdotal, though a good part of the property went to zero. 
D.P. Davis sold 875 acres near Tampa in 1924 for $18 million. People waited in line 
40 hours before the sale began. Most of the property was underwater. In 2005, San 
Diego-based Zarzar Land sold 10- and 20-acre lots of West Texas desert to eager 
buyers on eBay. The land was worthless. The local school district included 53 
students. It took 100 acres to support each cow. The Texas Attorney General’s office 
was asked to interfere but decided not to. “The only thing we could take action on is 
something like the Deceptive Practices Act, but if you look at their websites, they 
tell people there is no survey, no water, no utilities,” reckoned the Assistant 
Attorney General.

A skeptical view of the media would go a long way to restoring common sense. The 
parade of economists who echo Greenspan are daily features in the newspapers and 
television. In mid-summer 1925, the Miami Daily News set a New World Record with a 
506-page edition – almost all of it real estate advertising. On October 25, 1925, the 
Miami Herald published a story planted by a movie and real estate promoter who 
cautioned, “a treacherous Arctic current had been discovered off the coast of 
California and in a few years would freeze the California climate so severely that 
filmmakers would have to quit Hollywood and ship their studios to Florida.”

Homer B. Vanderblue wrote in 1927 the money spent on skyscrapers in Miami “has 
probably been lost exactly as though it had been sunk in drilling dry holes in an oil 
field.” In May 2005, Miami boasted 60,000 condominiums that had been sold but not yet 
built. Prices of houses and condos rose 28% in 2005. In South Beach, Miami, a new, 
20-story condominium sold beach cabanas for $850,000 apiece. 

That was last year. In 2006, the city’s condo supply is leapfrogging demand. 
According to Multiple Listing Service of Miami, 34% of the houses and condominiums on 
the market have dropped their price. Many listings, of course, have de-listed. But 
building continues at a ferocious rate: Empire World Towers, two, 106-story hotel and 
apartment buildings, are awaiting approval by the Federal Aviation Authority. Cranes 
over Miami are giving Shanghai and Dubai a run for the most blighted skyline.

Money poured in from points north and west. After the break, it fled. Deposits of 
clearing house banks in Miami rose from $56 million on December 31, 1924, to $191 
million in August 1925, and then fell to $98 million in June 1926. There were 
failures, but, as in California, the banking system acquitted itself. Vanderblue 
reported: “[T]he condition faced by the Florida bankers in 1924 and 1925 was quite 
unprecedented, and it is more remarkable, and greatly to their credit, that most of 
them were prepared for the shrinkage in deposits when it came. The plethora of funds 
had not been allowed to flow into land speculation but was invested mainly in 
corporate and government bonds…. The bank failures were relatively few in numbers….” 
Vanderblue goes on to commend the governor of the Federal Reserve Bank of Atlanta who 
visited every Fed member bank and made sure they were prepared for a collapse. Only 
one Fed member bank in the district failed. By comparison, Greenspan’s bizarre, 
February 2004, adjustable-rate “exotic loan” speech was pitched to the Credit Union 
National Association in Washington. The Fed chairman’s Open Wallet Policy was a clear 
signature of approval for the most irresponsible Florida banks and developers – some 
of whom must now wish the Atlanta Fed governor of 1925 was their regulator in 2005.

It is difficult to offer a comparison to the fate of Florida bank shares today. For 
what it’s worth, the common stock of the Land Company of Florida rose from $50 on 
September 11, 1925, to $89-3/4 at the end of the same month. A year later the 
theoretical price was $20 but was rarely traded.

Florida is merely the most benighted of the 1920s property speculation – the building 
spree crossed the nation. Losses were much greater than from the stock market crash. 
Prices in many cities have never recovered. Nominal prices of Baltimore residential 
property prices are still lower than in the 1920s. Prime commercial property prices 
in Omaha still trade at a discount to Jazz Age highs. In Boston, a lot on Boylston 
Street near Copley Square sold for $2.12 a square foot in 1873, $35.30 in 1912 and 
$3.00 in 1939. A building on Boston’s Arch Street sold for $33 a square foot in 1881 
and traded for $5.13 sq. ft. in 1940. A lot between Summer and Essex Streets sold for 
$2.50 in 1831, for $32.16 in 1916 and $1.80 sq. ft. in 1940.

The dollar has lost approximately 90% of its value since the 1920s. Besides being 
wrong on even a nominal basis, the claim that real estate prices always go up does 
not address what those dollars –going up, down, or sideways – would buy. Homer Hoyt’s 
One Hundred Years of Land Values in Chicago shows that some of the most fashionable 
addresses between the 1860s and 1880s – Michigan Avenue, Dearborn Street, Prairie 
Avenue – sold at prices as much as 50% lower at the height of the 1920s boom, and 
were often 90% lower than their peaks by the 1930s. Economists, especially from real 
estate trade organizations, love to drag out the argument that demographics support 
real estate prices. Yet the population of Chicago rose from 109,000 in 1860 to 
3,376,000 in 1930. (A great visionary who correctly forecast Chicago’s future from 
his Prairie Avenue mansion in the 1870s may still have gone broke if he was dealing 
in real estate.)

John Templeton, who has absorbed price changes in many markets across several 
decades, told Equities magazine in 2003 (well before the peak): “Almost everyone has 
a home mortgage and some are 89% of the value of the home (and yes, some are even 
more.) If home prices start down, there will be bankruptcies, and in bankruptcy, 
houses are sold at lower prices, pushing down home prices further. After home prices 
go down to one-tenth of the higher price homeowners paid, buy them.”

L.A. Times: Construction industry recovers from slump

Not a biggee. I feel this December 22 article by Lisa Girion is a milestone, in my opinion, because of the mass psychology reflected in it. The headline leads the casual reader to believe that the housing market has recovered sufficiently for builders to forge on the way they had up until a year ago. But when you read the details, all it says is that there was more construction hiring in November in the state of California than there was firing or layoff.

This psychology which we've seen for just about all of 2006, this refusal to admit that the housing market has been a problem, is one reason why I don't believe the housing market here is anywhere close to a bottom. When the headlines are talking despair and agony, then I'll be paying closer attention to signs of a turnaround.

Perhaps a more accurate headline might have read "Construction industry sees dead cat bounce in November."

Construction industry recovers from slump
By Lisa Girion
Times Staff Writer

December 22, 2006

After shedding more than 10,000 jobs during the housing slump of the past year, 
California's construction industry hired more people than it let go in November, the 
state said today.

The unemployment rate, which is based on a separate survey of households, inched up 
to 4.6% in November from a historically low 4.5% in October.

The construction jobs, along with hiring in information and healthcare, contributed 
to the creation of 15,900 jobs in the state overall last month, up from a revised 
10,600 in October, according to state payroll survey figures.

Most other sectors added jobs, including mining, manufacturing, trade, transportation 
and utilities, financial activities, professional and business services, education 
and government. For the year, the professional and business services category was the 
biggest gainer, adding 46,400 jobs, a 2.1% increase.

While the construction sector posted some rare good news on the employment front, 
leisure and hospitality, an area that had been going strong, shed jobs in November.

The biggest loser for the year was construction. Most of the losses were among 
specialty trade contractors, which declined by 6,900 jobs.

Year over year, employment in California was up 156,600 jobs, or 1.1%, in November.

Thursday, December 21, 2006

You won't see this chart in the local beach papers!

I will add this chart to my "other measures of beach city activity" report from now on. It is a median price chart for all four beach cities (El Segundo, Manhattan, Redondo, Hermosa) combined.

This is from my same realtor data source. When I looked at this, I had to laugh. Where is the "healthy appreciation" some claimed we were supposed to get this year? Where is this bottom we are supposed to have reached?

Wednesday, December 20, 2006

Other measures of Beach Cities market activity, November 2006

According to Shorewood's December 19 report, the median sale price in Shorewood's 18-city survey area fell 4.5% YOY in November, from $599,000 to $572,000. They note that prices in the "affordable areas" are actually rising. By now we know what that means!

The median price in the beach cities fell 11.4% YOY in November, from $925,000 to $819,000.

The report states that Palos Verdes Estates median price is up 39.3% YOY. I question that number. Maybe they are getting it from new construction, because according to DQ News Palos Verdes didn't do anything like that. Guess I better ask Shorewood:

Zip       # SFR   Median   %Chg   # Condo  Median    %Chg 
          Sales   $SFR      YOY    Sales   $Condo     YOY
90274        21   $1,445    9.1%       8   $327      -38.2%       
90275        35     $958  -20.4%       3   $500      -36.7%

Cities that were up include Lawndale at 20.7%. Number of homes sold increased in Inglewood and Hawthorne.

Months of inventory based on closed sales is 4.7, up from 2.4 in November 2005. That's about double the inventory YOY.

The one price category in which sales volume exceeded November 2005 was the $500,000-$749,999 category. The $1 mil-$1.5 mil category is roughly the same, but sales at and above $1.5 mil are down substantially. I do not expect the high end market to retain its value in this area, though for now that market appears to be hanging on, pricewise.

Shorewood reports average DOM for the beach cities at 60, actual sales at 143, and inventory at 667. DOM appears to be rising, while I-S/S has declined. This was expected, since we expect inventories to dip at this time of year.

South Bay Resale Activity for November 2006

Sorry this has taken so long. I had to bite the bullet and start reverse engineering some of this price data because numbers were seriously drifting. I assume this happens because the numbers that DQ News publishes in the L.A. Times are actually preliminary numbers. The final numbers do not get published, and we aren't aware of the changes until a year later, when we see %YOY values drift. For this reason, the %YOY change charts display the RAW %YOY numbers, so you can match them with the Dataquick values.

According to the DQNews listings in the L.A. Times, the November monthly resale activity for the south bay area showed the following:

Zip       # SFR   Median   %Chg   # Condo  Median    %Chg 
          Sales   $SFR      YOY    Sales   $Condo     YOY
90045      17     725,000  -9.3     n/a        n/a    n/a
90245       3     845,000  10.1      3     535,000  -17.7      
90254       5   1,260,000   0.8     12     820,000   11.4  
90260      12     518,000  12.5      5     345,000   19.0
90266      25   1,360,000 -26.3      5   1,100,000  -31.3
90277      20     978,000   2.9     23     725,000   17.0 
90278      26     763,000  -6.9     25     674,000   -3.1

County  5,167     540,000   2.9  1,277     410,000    0.7

Keep an eye on the dark purple lines in the median price charts and the bright pink lines in the %YOY change charts. Those are derived from moving averages. The herky-jerky month to month change in prices is enough to make anybody cross-eyed. The moving averages do a better job of illustrating the trend.

There is another data issue here, and that is having to deal with small numbers (in terms of sales). Notice how smooth the Los Angeles county median price lines are compared to those for individual zip codes - it's because the county charts are derived from infinitely more data!

A third issue here is the "sale bias." Even if prices are trending up, what does that say about the value of comparable properties in a zip code that remain unsold? Despite the drops in "official" inventories in these beach city zip codes, the fact remains that many would-be homesellers remained frustrated because they were unable to get their dream asking prices.

I'm noticing more rentals in my neighborhood now(North Redondo - Villas North). And yes, some of these are from homesellers who have given up trying to sell their homes - despite pricing their homes for "quick sale."

Beach city zip codes are 90245, 90254, 90266, 90277, 90278.

Thursday, December 14, 2006

L.A. Times: Regional home prices grow at sluggish pace

There isn't much new in this December 14 story by Annette Haddad that we didn't already mention. But I like to keep track of these stories to see how we are progressing along in our psychological milestones.

This article differs from the previous day's article when it state that 20,388 homes were sold in the six-county region. The previous day's story reported that 22,117 homes were sold.

The article acknowledges that November is a slow month for real estate. However, it characterizes the slowness in the southern California markets as a sign the market is "settling down." Experts state that decelerating prices and sales mean the market is looking to "reestablish its footing" after such a multi-year surge. The experts still deny the possibility of a more serious downturn.

However, some experts acknowledge that during the bull run, buyers priced in future gain, but now buyers are pricing in the possibility that values can and will decline.

Here is the same table from yesterday, with sales figures added.


                   % change     Median    % change
        Number of    from       price       from
County               homes sold   year ago  ($1000)    year ago
San Bernardino       2,926        -26.7      $380      +8.6%
Riverside            3,794        -35.7       426      +5.2
Los Angeles          7,351        -18.9       510      +2.6
Orange               2,475        -29.3       616       0.0
San Diego            2,987        -24.1       482      -6.9
Ventura                855        -30.8       562      -8.2
Southern California 20,388        -26.2       487      +1.7

Wednesday, December 13, 2006

L.A. Times: Home prices rise at lowest rate since '97; Housing still up in some areas

According to this December 13 story by Annette Haddad, the southern California housing market continued to lose steam in November.

The median home price (for all kinds of homes) for the six-county southern California region rose at the slowest rate of growth since February 1997, nearly 10 years. The number of homes sold - 22,117 - was the fewest sold since 1997. The sales rate was down 7.8% from October and down 26.2% from November 2005.

Here are the specifics. Wow, doesn't this look like a market bottom to you? Gee, Los Angeles county looks downright healthy compared to some of these other counties!

County        Median Price   %YOY    Sales %YOY
Los Angeles   $510,000       +2.6%    -18.9%
Orange        $616,000       flat     -29.3%
Riverside     $426,000       +5.2%    -35.7% 
San Bernadino $380,000       +8.6%    -26.7%
San Diego     $482,000       -6.9%    -24.0%
Ventura       $562,000       -8.2%    -30.8%    
6 counties    $487,000       +1.7%    -26.2%   

The experts at USC say yes, there is a correction going on, but they continue to state that nothing in the way of a collapse will occur. I would strongly agree with them if their statement were amended to say "by the end of 2006."


In a related story, Annette Haddad notes that prices continue to increase in the county's less expensive neighborhoods. And here are the details of that.

The Losers

                                median price     median price      %change
Area                Zip         Sept-Nov 2005    Sept-Nov 2006
Tarzana             91356       $1,175,000       $982,500          -16.4%
Beverly Hills       90210       $2,250,000       $1,897,500        -15.7%
Santa Clarita       91390       $757,500         $650,000          -14.2%
Manhattan Beach     90266       $1,570,000       $1,379,000        -12.2%
Rancho Palos Verdes 90275       $1,235,000       $1,091,000        -11.7%
Monterey Park       91755       $602,500         $532,500          -11.6%
Torrance            90505       $850,000         $758,750          -10.7%
Alhambra            91803       $561,500         $505,000          -10.1%
Palos Verdes Pen    90274       $1,590,000       $1,455,000         -8.5%
L.A. Rancho Park    90064       $977,250         $899,000           -8.0%

The Gainers


                                median price     median price      %change
Area                Zip         Sept-Nov 2005    Sept-Nov 2006
South L.A.          90061       $338,000         $435,000          +28.7%
South L.A.          90037       $375,000         $469,000          +25.1%
East L.A.           90063       $350,000         $422,273          +20.6%
South L.A.          90011       $356,000         $427,250          +20.0%
Inglewood           90305       $475,000         $570,000          +20.0%
Whittier            90602       $485,000         $577,500          +19.1%
Bell                90201       $415,000         $492,500          +18.7%
L.A. Lincoln Hts    90031       $415,000         $491,000          +18.3%
Pasadena            91103       $535,000         $630,000          +17.8%
L.A. Watts          90002       $335,000         $392,500          +17.2%

It sure looks like this bubble has shifted into the lower end areas, doesn't it? It doesn't surprise me, as these are probably areas with minority and/or lower income populations. Under the paternalistic guise of "making the American dream possible for everyone", these demographic groups have gotten sucked into the mania at the late stage, which is the way a mania typically plays out. The net gets cast wider and wider and they are the ones scooped up at the end.

Monday, December 11, 2006

L.A. Times: A loan that'll get ugly fast - "I am rather screwed"

While the analysts on Bloomberg crow about how bullish they are on the housing market, and how mortgage applications are up, this December 11 story by David Streitfeld will certainly help you see what is happening in the trenches.

Lots of homeowners in this state get to "choose" how much they pay each month on their mortgage loans. Pay option loans recommend to you an amount to pay to cover principle and interest, and another amount to cover interest only. Then there is another option to pay a very minimal amount. But you'll end up oweing bigtime as long as your option is to pay less than the principle and interest. And if you try to get out of such a loan, you get hit with a prepayment penalty that sounds criminal.

These loans are bets that a lot of things will happen - that the housing market will keep rising, or that the homeowner will inherit a chunk of money or get a big raise or. How far have these loans penetrated the California market? In 2003, only 8 out of every 1000 mortgage applicants did a pay option type of loan. In 2005, it was 1 out of every 5. For the first 8 months of 2006, it was nearly 1 in 3. Washington Mutual states that last December, 47% of its borrows took out pay option loans. So how many of those homeowners are making full payments, avoiding further debt?

Home buying now resembles auto leasing, where the monthly payment, rather than the price of the car, is what matters. But unfortunately, it looks like a lot of free money, and it isn't. Instead, pay option loans are a great way to fall into a sinkhole of debt.

Some lenders think all is well, claiming that their applicants have good credit scores. But how quickly can one's circumstances change of the worse, with a business failure or a layoff?

Thursday, December 07, 2006

Some neighborhood statistics

I thought you might like to see some of the statistics I am seeing in my Redondo Beach database. Below is the first 30 entries of my unsold inventory table, when sorted in descending order by percent of price reduction. I have included the street name but won't divulge any more information about the properties, in order to protect the privacy of the guilty.

                     Current     Reduction  %   DOM
  Street             Price $     $$$       Red
1 Esplanade          609000      190000    0.24 180
2 184th              989999      259991    0.21 229
3 Mathews            789000      206000    0.21 347
4 Knob Hill          975000      250000    0.20 154
5 Marshallfield      740000      179500    0.20 162
6 Ford               699000      151000    0.18 146
7 The Village        745000      154900    0.17 109
8 Paseo de la Playa  698000      141000    0.17 203
9 Juanita            998000      201000    0.17 149
10 Elena             979000      196000    0.17 134
11 Anita             999000      200000    0.17 182
12 Pearl             670000      129000    0.16 65
13 Elena             989000      186000    0.16 134
14 Grant             565000      104000    0.16 169
15 Catalina          469000       86000    0.15 198
16 Calle Miramar    1389000      250000    0.15 135
17 Prospect          724999      124001    0.15 106
18 Havemeyer         699999      119001    0.15 183
19 Catalina          940000      155000    0.14 114
20 Helberta          998000      161000    0.14 106
21 Mathews           699000      110000    0.14 184
22 Sebald            739900      110000    0.13 118
23 Rockefeller       650000       95000    0.13 122
24 Bataan           1049000      151000    0.13 99
25 Carlson           769000      106000    0.12 178
26 Harper           1149000      150000    0.12 108
27 Harper           1149000      150000    0.12 108
28 The Village       974500      124500    0.11 66
29 Loma              960000      120000    0.11 67
30 The Village       445000       54000    0.11 87

The DOM figure is today's date minus the date the property was first listed, as far as I could tell. #3 on Mathews is just about a year on the market now. It is a pity that some of these sellers got caught in the market shift nearly a year ago, and their realtors were still assuming the price gain momentum was still intact. With the other 470+ unsold/unresolved properties in Redondo Beach that I see in my table, it's clear that it's just getting harder and harder to sell a property that's been on the market so long.

The Reduction $$$ is the total reduction taken from the original asking price, in dollars. When I look at the reduced properties in Zip Realty, it is apparent that some of the properties take serious reductions in big chunks, but a lot of them just nibble away and shave off $10K, sliver off $5K there, to the point where it makes me crazy.

The asking price on this property is now down to $899900, from an original $989900 in June. This townhouse sold as new construction in March 2004 at $810000.

Monday, December 04, 2006

California Newspapers: Realtors' Lament - Pricing, Pricing, Pricing

I wasn't originally planning to post about the December 3 L.A. Times story "Jump Start That Sale", by Diane Wedner, but when I found "When Sellers Won't Budge", a similarly flavored article by Julie Claremont in the December 3 San Francisco Chronicle, I thought that perhaps this is a milestone in our real estate mood that should be logged.

According to the L.A. Times story, savvier realtors are stressing to their clients that listing their houses at the "correct" price is critical. And to determine what is the "correct" price, looking at what comparables are listed on the market for is not the way to go. After all, most of the homes currently sitting on the market are not selling. When looking at last month's sales (which should be analyzed by square foot), clients should check to see how long those homes sat on the market, and they should compare the features in the homes that sold and price their own homes lower if such features are lacking. Consider pricing the home so it "falls" into a price range that more people will consider. Price the home so it is the "lower" end of the neighborhood price range. And above all, if the property sits on the market for a number of weeks and stirs no interest, lower the price. Other strategies suggested include deciding whether or not to list the home on the MLS (leaving it off tends to work for higher end homes), and making the home available for showing at all times.

San Francisco brokers are so intent on pricing correctly that that is what is getting hammered into the heads of realtors. They realize that sales comparables that are 3 months old are now obsolete. In spite of such attention to this detail, most offers come in below the asking price. The San Francisco story then discusses how difficult it is for realtors to tell sellers that their homes aren't worth what they used to be worth, that a home's improvements and amenities do not mean that the house will sell at last year's prices. One agent recommends pricing 10% to 12% below the most recent relative sales comparables. "In a market where you can't drive down the street without seeing 8 to 10 For Sale signs, you have to stay ahead of the curve." And even when a lot of thought is put into pricing correctly, more homes in the area can suddenly pop up for sale on the market, then the agent must go to the seller and recommend a further price cut. Agents don't want to end up with an overpriced property sitting on the market, a big advertising bill, and a withdrawal form from the seller.


While almost none of this is new to housing bubble blog readers, I think these stories say something about the psychology fueling the market into the spring selling season. Realtors are in "slash the price" mood, even if sellers are not. Some sellers interviewed in the article were persuaded by their agents to sell when they were reminded of all the properties sitting on the market that haven't sold. Will this "slasher" mentality work and pressure sellers to cave in come spring? Will a flood of new listings hit the market come spring time, changing the rules again and forcing even faster slashing?

Friday, December 01, 2006

L.A. Times: Optimism is rising on housing market

Optimism is something we don't like to give up easily. Annette Haddad's December 1 article reports that some analysts believe the worst is over for the homebuilders.

Homebuilder stocks have been rallying since bottoming in July. Analysts at Fred Alger and Company say they are "sceptical of the warnings of pundits", and the small herd believing the worst is over contains former Fed chairman Alan Greenspan and current chairman Ben Bernanke.

But even though sales are still in a slump and there is three times as much inventory as a year ago, analysts cite the downshifting to low to moderate price increases "without calamitous results" as positive, with markets remaining "orderly". So slowing price gains are viewed as positive. Also cited as positive is "improved affordability." In addition, the recent drop in longer-term interest rates are the reason why a "precipitous drop" is less likely.

I am not making this up. I don't know whether to laugh or cry after reading a report like this. If price gains are slowing down but still gaining, how is housing more affordable? How is California's affordability improved if, according to one analyst's survey, California house prices increased by over 10% in Q3? Oh, is it because the California Association of Realtors recently jiggled their home affordability index so more people would qualify to buy homes? When I read an article like this that so clearly illustrates the cognitive dissonance in the heads of these analysts, I get the feeling I just heard fingernails on a blackboard.


It's probably too early to really make good analytical use of my Redondo Beach database, but at the moment it contains 500 inventory records. According to the tallies at Zip Realty the inventory for Redondo Beach is currently at 395. My database contains roughly 20% more records. Why the difference? Because when listings expire, my records don't disappear. They live on. How will those records come to some kind of resolution?

Some owners genuinely change their minds about selling their houses. A friend of mine who bought a Long Beach house as a fixer-upper to flip did just that, when she couldn't sell her remodeled home in the spring. She decided to keep the house and live in it, and it worked out well for her family. I have no simple way of discovering these outcomes (the thought of driving around and knocking on doors did briefly occur to me), so I can't resolve those inventory records. Hopefully, those cases are rare, and they've probably gotten rarer as speculators have exited the market.

Some sellers decide to rent their places out. There's been evidence of that in the big condo complex two doors from me. Unfortunately I cannot really resolve those either, they just remain in my inventory database as permanently unsold. I don't know how to estimate how many owners decide to do that either.

Some sellers keep relisting their properties. Those will be tallied at Zip Realty. Some properties temporarily disappear from the MLS when their listings expire, before they get relisted. What else can happen? Some sellers may go into foreclosure, or declare bankruptcy, or whatever. It's all the same, if their property still ends up in the queue needing to be sold. A very few records are errors, e.g., duplicate listings. And of course one thing that can happen is that a property actually gets sold. In that case, the listing goes into limbo between the time of sale and before the sale shows up in public records that I can access - when I can finally obtain a sale record, then I can resolve the inventory record.

Out of 500 inventory records, I have only been able to find 30 matching sales records so far, admittedly from a not quite "complete" table of 4,500 Redondo Beach sales going back a few years (I still need to add sale records from the extreme southern end of south Redondo). So each of the remaining 470 inventory records is in one of the states described above. Of the extra 105 records, some 20% of all my inventory records, are we to believe that those owners permanently changed their minds about selling, or rented their places out because they couldn't sell? Or are we going to see those unresolved properties reappear in the 2007 listings? And that's not even considering what will happen to all the "official" inventory of 395 records in the MLS.

Real Estate $$$ Transacted through November 2006

First, a few apologies. I discovered some data errors in Palos Verdes (90275), and in Inglewood combined. PV home sales are still severely down, though not quite as much as I thought before. And Inglewood was just a touch more bubbly than I thought.

And now a few announcements. By New Year's I will have drastically overhauled these zip code charts to simplify my work. There are just too many to format at the end of each month. It has been tough making choices between breadth of area coverage and depth coverage but I think with a few changes this will be more manageable for me. I am trying to stick with west of the 110, south of the 10 freeways, since nobody else seems to be doing this area in depth. It's also very obvious that real estate money is draining out of what are considered the more affluent areas and the bubble is still alive in the not-so-affluent areas, so it's important to track these latter areas. However my concentration will remain first Redondo Beach, second, Beach Cities, then the general area last.

This month I am introducing a new chart to give a trendline view of the doubly smooth moving average. I will be adding the raw trendline to this new chart and then by New Year's do away with the column charts for raw and moving average data. I will also keep the YOY change chart. So eventually each area covered will just get two charts. And we aren't losing any information at all, it'll just be in a different form.

I think the trendline view of the historic data is helpful because then it is easier to see what the YOY gain or loss is based on.

I will discontinue use of the Google Maps tool, since so few people seem to use it. In addition, zip codes will be aggregated into single charts. I will probably discontinue charting individual zip codes for Inglewood and for Torrance.

I haven't decided where to group Palos Verdes (90275) yet. I like lumping it with the Beach Cities but the beach city collection as it is now corresponds to what Shorewood Realtors reports, and I'd like to match that.

The aggregation will (tentatively) be as follows:

  • Beach Cities - stays the same, may add PV: 90245, 90254, 90266, 90277, 90278
  • Culver City: 90230, 90232
  • Inglewood/Lennox - discontinue individual zip codes: 90301-90305
  • Hawthorne, Lawndale, Gardena: 90250, 90260, 90249
  • Ladera Height, Baldwin Hills, Leimart Park: 90008, 90056
  • Mid City: 90016, 90018
  • Redondo Beach: 90277-90278
  • Santa Monica - stays the same: 90401-90405
  • Torrance - discontinue individual zip codes: 90501-90505
  • South Central (west of 110): 90007, 90037, 90043, 90044, 90047, 90062
  • Westside - Palms, Rancho Park, Mar Vista, Venice: 90034, 90064, 90066, 90291
  • LAX Westside - Playa Vista, Marina Del Rey, Playa Del Rey, Westchester: 90094, 90292, 90293, 90045
  • San Pedro, Lomita (maybe PV): 90732, 90717, maybe 90275

Now, on to this month's data:

There was a last minute clump of sales entered on December 1 into Melissa Data, that maybe doubled what had been in place up to November 30 for the beach cities. Even so, $$$ volume, to put it nicely, looks terrible. It'll be obvious from the new chart that we had no summer selling season to speak of, and any little itty bitty bounce we're getting now is pretty pathetic.

The new chart makes clear how seasonal real estate is in the beach cities. Keeping in mind that this is a double smoothing on a 3 month moving average, we know then that instead of peaking around October, as the charts show the previous few years, the seasonal peaks really come a few months earlier than what is shown. So our "real" seasonal peak is really July-August or thereabouts.

Taking the new chart at face value, we can see that we hit a slightly lower trough in April-May 2006 than in the corrsesponding time in 2005, and that unlike 2005, when sales kept climbing through July and surged into October 2005, July 2006 saw sales severely wilt and start trending down. I'm sorry, Mr. Greenspan and Mr. Lereah, but there's no sign of a recovery here!

You can view all four charts below blown up on one page.

Listed below is %YOY change on the moving average in the individual areas that are charted. Here is the link to the October numbers for comparison:

Real estate on steroids (realtors fat and happy):
90305 171.7% Inglewood
90746 32.4% Carson
90301-90305 29.6% Inglewood/Lennox combined
Doing very well:
90037 14.4% South Central
90303 9.5% Inglewood
Hanging in there:
90043 3.4% Hyde Park, Windsor Hills
90260 2.4% Lawndale
90304 1.8% Lennox
90302 0.2% Inglewood
90044 0.1% Athens
Slip sliding away:
90047 -1.7% South Central
90245 -2.7% El Segundo
90301 -3.7% Inglewood
90744 -4.1% Wilmington
90062 -5.1% South Central
90502 -9.7% Torrance
90250 -10.3% Hawthorne
Losing a grip:
90066 -16.4% Mar Vista
90249 -19.0% Gardena
90007 -19.1% South Central
90232 -19.4% Culver City
90501 -19.6% Torrance
90266 -19.7% Manhattan Beach
90016 -20.2% West Adams
90018 -20.3% Jefferson Park
90230 -22.4% Culver City
90045 -22.5% Westchester
90504 -24.8% Torrance
About to go over a cliff (realtors getting hungry:
90277 -26.8% Redondo Beach (south)
90008 -27.0% Baldwin Hills / Leimart Park
90501-90505 -27.6% Torrance Combined
90035 -28.5% West Fairfax
beach cities -28.7% 4 Beach Cities combined
90019 -28.8% Country Club Park/Mid City
90277-90278 -31.3% Redondo Beach combined
90745 -31.6% Carson
90717 -32.5% Lomita
90278 -34.2% Redondo Beach (north)
90505 -35.9% Torrance
90275 -36.8% Palos Verdes Estates
90292 -37.4% Marina del Rey
90503 -38.0% Torrance
90732 -38.2% San Pedro/Rancho PV
90036 -38.3% Park La Brea
90034 -39.0% Palms
90293 -40.9% Playa del Rey
90056 -43.1% Ladera Heights
90291 -46.7% Venice
90064 -47.2% Rancho Park/Cheviot Hills
90254 -48.0% Hermosa Beach
Sliding down a cliff (realtors really hungry!)
90401-90405 -55.2% Santa Monica combined
90094 -55.3% Playa Vista

By the way, even though I don't publish the charts, I do report on the YOY change in $$$ volume in certain zip codes and I will continue to do so.

I will repeat again, this is not price data, this is $$$ volume. Visit our regional real estate $$$ tracker for details on a specific area and a more thorough explanation of these charts.

Dogmation