Friday, September 29, 2006

Real Estate $$$ Transacted through September 2006 for Beach Cities

The September "bounce" in sales looks like it fizzled out. The slowdown we've been seeing in the beach cities continues in earnest. It's amazing to think that, on a YOY basis on the moving average, dollar volume in Hermosa Beach is down 50% and dollar volume in Redondo Beach is down 33%. It must be getting quite tough to sell a house in these areas. Look at the Beach Cities charts at the bottom of this post and notice that YOY line continuing its downward trek. And even some of the surrounding areas that have remained strong are now starting to exhibit softening.

I am trying to expand (and limit) my coverage in these monthly charts to the area west of the 110 freeway and south of the 10 freeway. However there are a few zip codes with data that looks way too wacky to chart. The zip codes I am excluding for this reason, are, to the best of my knowledge: 90710, 90231, 90247, and 90274. (I am pretty tired right now, so I may have excluded more, I just can't locate them at the moment.)

You can access individual zip code charts here. You can also try our Google Maps tool but I have not had time to update it with all the additional areas I am covering yet. It also seems very slow at times.

I've spotted a few data errors in 90094 and in some of the worksheets in which zip codes are combined. Fortunately the errors have not affected the beach cities combined, our main focus here.

Keep in mind that these charts for September don't "officially" cover all of September. I did them on September 30, on a day when there were probably more sales that are not yet tabulated. Also, I noticed in the Melissa Data this weekend that on occasion prior months get updated. I try to catch those adjustments when I spot them. Those minor deviances don't change the overall trend we are witnessing.

Also, it's a good idea to keep in mind that just because a YOY line dips below 0% in a chart it doesn't necessarily spell disaster for the particular zip code represented in that chart. Data and derived trends have to be taken in context. Perhaps the previous year was an exceptional year in a particular area because a slew of new homes came on the market and there was no new offering in the current year. Look at the YOY charts and you will see numerous times when a trendline has dipped below 0% but then bounced back. I think, however, that when one takes into consideration recent economic data, such as our recent inverted yield curve and a very weak Philadelphia Manufacturing Index, and the impact of creative mortgage financing, then that dip below 0% becomes more meaningful. The longer it stays below 0% and the further away it moves below 0%, the more ominous it could be.

The numbers in the lists below are the September YOY percentages on a doubly smooth moving average. The lists contain some added zip codes that are outside my intended reporting area, just so there is more to compare. I went and made up charts for those zip codes, but just haven't uploaded them. Notice that some of these surrounding areas are still doing quite well on a relative basis, though there are signs that the steroids are starting to wear off.

Real estate on steroids:
90305 352.1% Inglewood
90094 70.1% Playa Vista
90301-90305 36.5% Inglewood/Lennox combined
90304 31.8% Lennox
90245 27.6% El Segundo
90746 27.5% Carson
90062 23.9% South Central
Doing very well:
90043 17.5% Hyde Park, Windsor Hills
90047 11.0% South Central
90744 10.5% Wilmington
90301 9.3% Inglewood
90037 8.7% South Central
90260 7.3% Lawndale
90502 5.7% Torrance
90745 5.7% Carson
Hanging in there:
90504 1.9% Torrance
90303 0.9% Inglewood
90302 0.8% Inglewood
Slip sliding away:
90018 -2.1% Jefferson Park
90250 -2.9% Hawthorne
90016 -5.1% West Adams
90044 -5.1% Athens
90501 -7.0% Torrance
Losing a grip:
90230 -11.2% Culver City
90501-90505 -11.3% Torrance Combined
90045 -11.3% Westchester
90266 -14.3% Manhattan Beach
90249 -16.9% Gardena
90035 -17.0% West Fairfax
90505 -19.0% Torrance
About to go over a cliff?
90503 -25.0% Torrance
90066 -25.1% Mar Vista
90036 -25.6% Park La Brea
90019 -26.1% Country Club Park/Mid City
beach cities -26.3% 4 Beach Cities combined
90008 -27.8% Baldwin Hills / Leimart Park
90717 -30.7% Lomita
90007 -30.8% South Central
90292 -31.9% Marina del Rey
90278 -32.2% Redondo Beach (north)
90277-90278 -33.3% Redondo Beach combined
90277 -34.8% Redondo Beach (south)
90034 -36.7% Palms
90291 -36.9% Venice
90732 -37.8% San Pedro/Rancho PV
90232 -38.7% Culver City
90056 -41.2% Ladera Heights
90275 -43.7% Palos Verdes Estates
90293 -43.9% Playa del Rey
90064 -47.2% Rancho Park/Cheviot Hills
90401-90405 -47.7% Santa Monica combined
90254 -49.5% Hermosa Beach

With all the technical weakness we've charted here in this blog, it's pretty amazing that we haven't yet seen headlines about prices collapsing.

Here is the August link for comparison:

Compare to August, 2006.

And here are the Beach Cities (90245, 90254, 90266, 90277, 90278) charts:

Thursday, September 28, 2006

L.A. Times: UCLA Group Predicts Flat Home Prices - personally I don't think Anderson gets it

There are accolades for the UCLA Anderson school for calling the bubble in this September 28, 2006 L.A. Times story by Lisa Girion, but now Anderson is talking in a mealy-mouthed two-sided fashion about how it doesn't rule out a recession but doesn't expect one.

While Anderson does say it expects the state and national economies to slow, it reasons that homeowners would rather hold on to their homes in a sinking market than sell into a sinking market. For some reason their decision to do that hinges on whether there is a recession or not.

Really? Anderson clarifies this by stating that job loss could force a homeowner to sell. People would rather stay put because they still have dreams about being able to sell their house for what the neighbor got for his house back at the peak in 2005. (OK, well Anderson didn't exactly say it that way, I said it that way.) But when the dream is let go, and panic sets in, what then? The Anderson school of business is probably not exactly brimming with psychologists who specialize in crowd psychology.

And this is the quote we should remember: "Expect home prices five years from now to be about the same as they are today, though lower in real [inflation-adjusted] terms by 15-20%." And, "We are not going to see anything like the '90's again." "It won't be anywhere near as bad as the stagflation of the 1970's." "What we had in the 1970's, you could call pneumonia. You could call this a low-grade cold."

Anderson hedges its hedge by stating that if the trend accelerates, their forecast is "too optimistic." Well duh.

Blog readers, I submit to you this link about Nightmare Mortgages. On this page is an "online extra" called Map of Misery. This is a map showing the percentage of new and refinanced mortgages that went into the creative loans that are ticking time bombs. Take a look at how the state of California is colored compared to even the Housing Bubble Ground Zero spots like Arizona and Florida. And then take a look at the percentages for new loans in Orange County, San Diego, and Los Angeles-Long Beach. I think Southern California is at risk.

It continues to astound me that forecasters do not want to even consider and discuss the possibility of drastic price declines, on the order of 40%, 50% and more. They won't talk about them until they've already happened, which isn't going to help you if you are thinking about selling a house. I sincerely hope that there isn't anybody out there who is basing their real estate selling decisions on what these "experts" are forecasting. Forecasters like to herd along with everyone else, and they will only say the things that are safe to say.

What the August new home sales stories do not tell you

The spin that is driving the stock market higher is also making new home sales for August look much better than they were. Sales in July were revised downward so July was actually worse than it even looked initially. (Maybe they whispered that on CNBC this week amidst all the stock market cheerleading, but not many caught it.) So on a national basis, new home sales rose "unexpectedly" in August by 4.1% from the downwardly revised July number.

I don't make this stuff up. People like the CNBC spin meisters are whacking themselves on the heads with hammers, then they stop the whacking and report how great things are now that they've stopped the whacking.

Not everyone is falling for it though. As one A.G. Edwards analyst with a clue points out, there have been downward revisions of home sales for May, June, and July, so "the story is the housing market is still on a downtrend." With orders for durable goods falling two months in a row and that Philadelphia Manufacturing Index collapsing, this economy does not look as good as it superficially appears. Smells like early 2000 all over again.

Anyway, back to the new home sales in August numbers. In this September 24, 2006 story by Ann Brenoff, titled "A Maserati - as bait", it turns out builders (as well as other sellers) are using new cars, new trucks, new plasma TVs, and vacations. Here in California, Centex Homes "is offering Southern Californians special financing programs with initial rates starting at 0.875%. Up north, the same builder was giving away in-ground swimming pools. Another builder up north offers annual memberships to a golf club. These extras are not taken into account in home sales figures.

But some are starting to wise up. A few people out there actually do realize that it makes more sense to just knock the $40K or so off the sale price and spare the gimmicks. The buyer could end up with a lower property tax bill as a result.

Well, we know that builders have tried Easter egg hunts and fake families to sell places, and new house coloring books for the kiddies, and that other sellers have used string quartets, celebrity book signings, and gourmet chefs at open houses. But I'm not hearing any glowing reports about the effectiveness of all this gimmickry.

Wednesday, September 27, 2006

L.A. Times: Plunge in Sales of Existing Homes in California Largest Since August 1982

In a September 25, 2006 L.A. Times article by Jesus Sanchez titled U.S. Median Home Price Suffers First Slip in Ten Years, it is noted that California existing home sales volume in August has suffered its biggest YOY drop in 24 years. Existing home sales have fallen 30.1%. In August 1982, sales tumbled 30.4%.

At least Leslie Appleton-Young of the California Association of Realtors (CAR) is hedging her bets now when she notes that some California regions have experienced YOY declines now for more than two months, and that the longer-term trend "remains to be seen."

Is David Lareah of the National Association of Realtors (NAR), rewriting history when he claims that, on a national level, the YOY median price decline of 1.7% for existing homes is the decline "we've been expecting" ? Then he goes on to say sales are stabilizing and "we should go on to positive price growth early next year."

Other analysts are rightfully sceptical. High Frequency Economics notes that "...the speed of the collapse has been astonishing. With inventory rising, there is no chance of any short-term relief. Prices and volumes have a long way to fall yet."

FYI: CAR is holding its 2006 EXPO at the Long Beach Convention Center October 17-19.

Anecdotally: Last night I went through my drawer of real estate flyers for my area (Villas North section of north Redondo Beach) and out of curiosity thought I would make sales price notes on them so I could compare asking prices with sale prices. I did not count the flyers but estimate maybe two dozen. The flyer geographic distribution is admittedly rather lopsided, without adequate representation of all the streets around here. I've been tracking sales statistics through Melissa Data but I still have to say I was astounded that of all these properties, only about 3 had sales recorded for them. The remaining twenty or so properties had no record of a recent sale in Domania or in Zillow. Most of these flyers are several months old. That tells me that either tons of listings are still ongoing after many months or that a number of sellers gave up earlier this year trying to sell their homes. It's probably a mix of those two factors but since inventory has recently dropped slightly I am inclined to think the latter weighs heavily in that mix. So what will next spring be like? Will the sellers who gave up trying to sell last spring try again next spring, adding to a pool of new sellers who are trying to sell their properties for the first time? Will I see forests of For Sale signs reminiscent of what I witnessed in Lomita in 1989-1990?

Tuesday, September 26, 2006

L.A. Times: Data on Homes Causes Jitters

Well, there isn't too much additional hot air I can blow about this September 26, 2006 L.A. Times story by Tom Petruno, since it is more national in scope. However I will point out a few items from the article on California and So Cal in particular.

On a national level, median home prices declined 1.7% in August YOY, the first such drop since April 1995. Number of homes sold fell for a fifth consecutive month and inventory is reaching record levels. The price picture is holding up better here in Southern California. The August median price for a Southern California (all homes) was $489,000, up 2.7% YOY. The statewide median price of a resale SFR was up 1.6% YOY to $576,360. However, statewide home sales plunged 30%, and our local area builders, realtors, and mortgage lenders are really starting to feel the effects of a slowdown.

We know from recent news stories that CountryWide Financial, for instance, is laying 5 to 10% of its general and administrative staff. Builder Ryland Group of Calabasas says it cut its workforce by 3000, about 10%. A San Diego branch manager for a construction supply company believes that the "job losses were just beginning." For the three months ending in August, some builders are reporting a plunge in orders at the rate of 58%. "Things are clearly turning down pretty hard." However other analysts still believe the impact of the declining housing market on employment will be modest. Really? Let's see - trade contractors, construction workers, realtors, mortgage lenders, property managers, furniture suppliers, car dealers that sell trucks to contractors - and all the clerical, administrative, and IT tech people who love and support them - are all potentially affected by the fallout. And my guess is that most of those jobs beat pizza delivery and sign twirling in terms of income. Let's see how modest the impact on employment this downturn will be.

And then of course there is the wealth effect. The theory is that consumers spend more lavishly when they feel wealthy. How will they feel when the values of their homes drop and how will that affect their spending? Unfortunately, analysts such as the USC Lusk Center for Real Estate and Pacific Investment Management of Newport Beach practically equate "untapped equity" with sure-thing, monetized, cash in the hand, claiming that people have "a ton of money" in their homes that could be spent. And I say, oh yeah? We have real estate experts and economists at a top-rated university in the country who don't understand the difference between money and credit. And even a child can understand that a bird in the hand is worth two in the bush.

Well, David Lareah, chief economist of the NAR, has one thing right. "Prices are going to get worse before they get better." If he limited his comments only to that, he'd sound like a genius.

Monday, September 25, 2006

Update on 2500 Nosnibor

Long time blog readers know that I first noticed this new luxury Craftsman home listed late October 2005, with the asking price at the time $1,290,000. (I am not aware of any earlier listing or higher asking price prior to this.) It went through many relistings. In June it was relisted at $1,149,000, a reduction of over 10%. The home has finally sold in September 2006 at a price of $1,015,000. That's a sale price 21% below the October 2005 asking price. And I wonder if the seller had to make additional concessions.

Let's remember that. 11 months to sell, 21% haircut off of original asking price, in zip code 90278.

Sunday, September 24, 2006

Other measures of Beach Cities market activity, August 2006

Shorewood Realtors report south bay home prices as demonstrating continued "resilience". Will prices "flatten" in a much-hyped "soft landing" that we hear about ad nauseum? Or will they decline? Lets take a look at our internal measures of market strength.

Days on market (DOM) is a measure known to be a bit deceptive, since it does not account for listings pulled off the market because the sellers could not get the offers they wanted. Also, when a home is relisted after its previous listing expires, the clock starts at 0 again, so DOM does not take that into consideration either. (Anecdotally, I am aware of homes in my neighborhood that have been listed many months.) In spite of these drawbacks, we see DOM starting to creep up here. The DOM numbers are found in the Shorewood reports.

For the month of August, my supply strength (AKA demand weakness) ratio has reduced very slightly. The moving average still edged up, though at a slower rate than in prior months. The August reduction can be expected for a few reasons. One - after a horrible July, any real estate activity prior to school starting is bound to look better on a relative basis. Two - inventory can also reduce when listings expire unsold or sellers pull their homes off the market because they can't get asking prices and they refuse to lower their prices.

Overall, this is no recovery to speak of. A great deal of technical damage has been done which would take a while to reverse.

For those of you not familiar with my Housing Supply Strength (Demand Weakness), it is simply (inventory-sales)/sales for the four major beach cities (El Segundo, Hermosa Beach, Manhattan Beach, Redondo Beach) according to the Shorewood data. In a market where the number of homes sold is about equal to inventory of homes available, this number would be close to 0, as it was around May-June 2005. I call that time period the market peak for this area. Since that time, (I-S)/S has been climbing, which I interpret as steadily weakening demand, or increasing supply strength, to be politically correct, which realtors translate as "more homes to choose from".

Hopefully I'll get September $$$ transaction charts posted next weekend.

Friday, September 22, 2006

DQNews South Bay Resale Activity for August 2006

According to DQ News, the August Monthly resale activity for the south bay area showed the following:

Zip     # SFR   Median   %Chg   # Condo  Median    %Chg 
        Sales   $SFR      YOY    Sales   $Condo     YOY
90045    31     799,000   5.1      3     385,000    6.9
90245    11     908,000  17.9      8     610,000   14.0      
90254    12   1,218,000 -16.0      8     915,000   15.1   
90260    15     525,000   6.9      7     346,000    9.0
90266    47   1,850,000  25.9      4   1,543,000   41.5
90277    17   1,123,000  12.3     22     606,000  -10.6 
90278    25     765,000  -0.5     23     650,000   -6.3

The beach cities charts below look strictly at resale activity for existing SFRs. The pink line is the raw %YOY change in the median price. The dark blue line is the %YOY on a doubly smooth 3 month moving average of the median price. I like to take moving averages because seasonal activity does not always "match up" (e.g., sometimes Easter sales fall more in March, sometimes more in April.) Beach cities zip codes are 90245 (El Segundo), 90254 (Hermosa Beach), 90266 (Manhattan Beach), 90277 (south Redondo Beach), and 90278 (north Redondo Beach).

The bubble is not going quietly. There was a slight rebound this month in median price activity. Considering that in past years we've had summer sale surges that have leveled off toward fall, the rebound is not particularly impressive, but we'll keep an eye on it. I'm still looking at the doubly smooth 3 month moving average (blue line), not the pink jerky month by month change (pink line). Those blue lines are still trending down. 90245 (El Segundo) and 90254 (Hermosa Beach) fall below 0%; 90266 (Manhattan Beach) has lightly bounced off the 0% line; 90277 and 90278 (Redondo Beach) still seem to be working their way down to 0%.

I will be doing the September $$$ volume charts next weekend. Only 90245 at this point exceeds sales volume YOY from September 2005. If current sales rates continue, sales volume for the other beach city zip codes will be way down YOY. And $$$ volume remains weak.

Wednesday, September 20, 2006

L.A. Times: Home Price Appreciation Slackens

There are are some interesting statistics to note in this September 20, 2006 L.A. Times story by Annette Haddad The rate at which Southland home price appreciation is flaming out is just as fast as the rate at which appreciation flamed out in 1989-1990. At that time, YOY price appreciation went from double-digits to zero in just eight months.

In May 2004, Southland home price appreciation (that includes condos as well as SFRs) hit a peak of 27%. In March 2006, the rate of appreciation was 10.7%, still double digit. In August, the rate of appreciation was 2.7%, the lowest level since July 1999, which was over seven years ago. The last time all six Southland counties posted single-digit increases was December 1999, almost seven years ago.

If history were to repeat itself exactly, then we'll hit 0% appreciation in November or thereabouts, which starts in just six weeks. And we aren't really even talking about median price declines yet, we're just talking about going from double-digit to 0% YOY appreciation.

And still, the "experts" and "analysts" do not want to consider the possibility of severe price declines. They certainly haven't held back in the past on forecasting continued appreciation but I guess when it comes to loss of home values, forecasting is forbidden - seeing is believing. Experts see a "leveling off" of values, or "even a decline in prices", as if the potential for values to decline were still extremely improbable at this point. No, the market will "flatten out." It will "come back into balance."

So even though appreciation is flaming out at the same rate as it did in 1989-1990, to quote Haddad, "few experts predict that Southland home prices will retrench at the rate they did during the last downturn, when prices fell 17% between 1990 and 1996, according to DataQuick." (Remember - that 17% number is an umbrella value for the entire six-county Southland region. Your particular area may have flamed out a lot more or a lot less.)

The experts like to point out the job losses and recessions that led to the 1990's downturn. They say that history does not offer any data about the situation we are in now, with a recession "nowhere in sight."

OK, I will offer my interpretation. The recovery from the 2001 recession was fueled by lower interest rates and ridiculously easy lending standards which was like handing the U.S. population a giant credit card by which we could hyperinflate home values and spend until we're dead. We have a negative savings rate (even by fiddled and tweaked government revisions) and record levels of debt. We've had an inverted yield curve for the better part of a year, an indicator which has had a good historical record signalling slowdowns ahead, but which the Federal Reserve calls a "conundrum", caused by a "global savings glut". Is this unprecedented in history?!? YOU BET.

Gosh darn, these economists are thinking, if only the rest of the world created a consumption bubble like ours, we wouldn't have this savings glut, then everything would be normal again. Then we could take our fingers out of our ears and stop singing "LA LA LA WE CAN'T HEAR YOU!!!"

I will be the first to admit that the stock market, which is now testing its May 2006 highs, does not appear to be anticipating a recession. But because of the massive amounts of credit sloshing around in our capital markets, we may well be in a situation where such an incredible distortion of values has occurred that some of our tried and true leading indicators are broken. We are flying an airplane with badly calibrated instruments. There could be something worse lying ahead than a recession.

It's kind of like dog training. When a dog growls, thank him. He's giving you fair warning. When you keep punishing the dog for growling, he'll stop growling. And then go directly to the bite.

Tuesday, September 19, 2006

L.A. Times: Local Home Sales Down 25% From Last Year

This September 19, 2006 L.A. Times short piece by Jesus Sanchez confirms what the bubblewatchers have been feeling in their bones. August 2006 home sales (including condominiums) for Los Angeles, Orange, San Diego, Ventura, San Bernadino, and Riverside counties are down 25.3% from August 2005, for a total of 25,628 sale units.

We can look at the various county data here:

                  % YOY     $$$
County            Median   Median    
Los Angeles        4.7%   $517,000
Orange             2.6%   $633,000
Riverside          7.0%   $415,000
San Bernadino      6.1%   $365,000
San Diego         -2.2%   $415,000
Ventura            1.0%   $592,000

The only socionomic item to note is that DataQuick analysts, when describing the "moaning" in the market, and observing that prices have doubled in 4-5 years, assume the market will "keep" the great majority or all of that gain. In credit-induced bubbles, virtually all the gain is erased and then some, in an "overshoot" to the down side. We have a long wait ahead of us to see if this rule holds up.

When DQNews posts the August zip code charts I'll post the monthly beach city median charts.

Sunday, September 17, 2006

Daily Breeze: California residents decide Golden State is tarnishing - "...Our amenities are being outweighed by some of the perceived costs..."

Housing costs have become too rich for many, making this the most popular state to leave, according to this September 17, 2006 story by Muhammed El-Hasan in the Daily Breeze (link will expire).

You'd think that with the influx of immigrants (legal and otherwise), California population would be growing. But not according to this article. The net outflow between July 1, 2000 and July 1, 2005 exceeded an average of 133,000 people a year. The current rate is about twice that, and this is at a time of a "strong" economy. The outflow is at its highest point since the mid-1990's, when an aerospace downturn and recession drove so many out of state. Los Angeles County saw a net outflow of 154,320 residents to other counties from July 1, 2004, to July 1, 2005, according to the Census Bureau. (The article does not say it but I suspect San Bernadino and Riverside counties are popular destinations.) The outflow of residents from California has been good news for realtors in places like Las Vegas.

Gee, do you think our surrealestate values have anything to do with it?

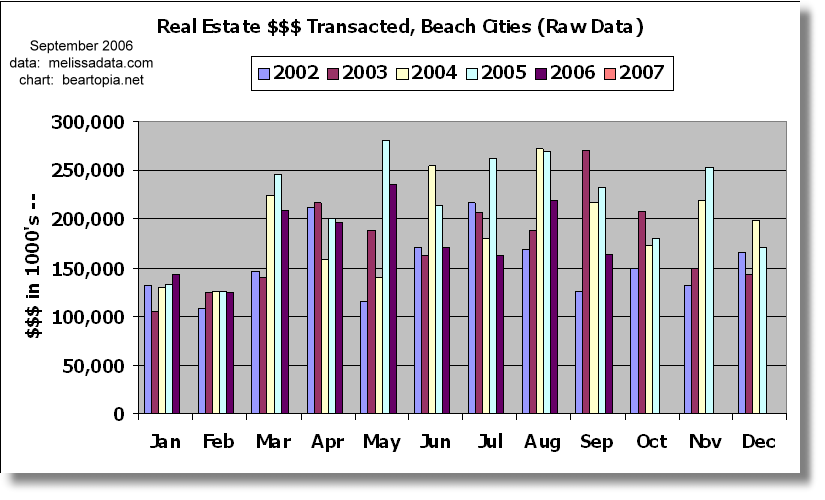
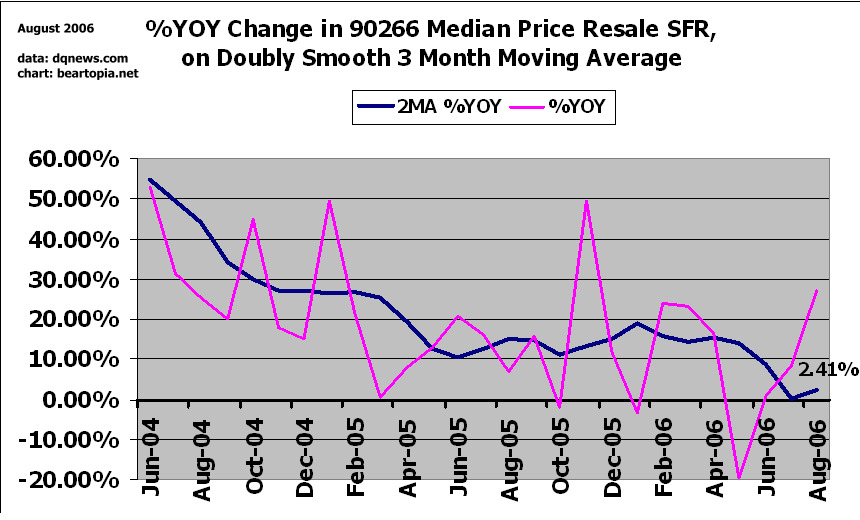
The July median price for a SFR in all of California was $567,360 according to the California Association of Realtors. In Torrance, that figure was $610,000. Prices were about half their current level just five short years ago.

Right now, despite the net outflow, California remains a popular immigrant destination. I'm not sure if the article is contradicting itself or not, but it goes on to say that "the number of immigrants admitted to the state from Oct. 1, 2004, to Sept. 30, 2005, almost equaled the net loss of residents to other states from July 1, 2004, to July 1, 2005. California's immigrant infusion appears to effectively nullify the population loss to other states, in terms of numbers."

It is my own opinion that if an economic slide downward were to materialize, this could greatly change, as nations move toward restricting immigration (people tend to get more xenophobic during economic hard times). Restricting immigration to California would probably exacerbate an economic/real estate downtrend - who's going to buy up all those dot condos and houses? Of course by the time we were to reach this point, it is possible that credit would be greatly tightened, making it much more difficult for anybody - immigrant or resident - to buy property on what might seem like very conservative terms right now. It's difficult to anticipate exactly what will happen.

If you haven't read it, I strongly recommend Schizomania, which macroeconomically explores real estate as a part of our development over 120 year cycles that overlap each other. Long-term migration patterns play the most significant role in the future real estate boom areas and bust areas.

----------------------------------------------------------------------------

Go west, young man.

Or maybe not.

The popular 19th-century adage urging Americans to move westward in search of new 
opportunities has been turned on its ear -- at least where California is concerned.

The nation's most populous state, a traditional magnet for throngs of daring, 
ambitious people seeking everything from gold nuggets and great weather to good jobs 
and Hollywood glamour, now carries an unflattering designation.

The Golden State is No. 1 in outward migration of residents to other states, 
according to the most recent figures provided by the U.S. Census Bureau.

From July 1, 2004, to July 1, 2005, the net flow of residents from California to 
other states -- those moving to the state minus those leaving -- was negative 239,000 
people. That's higher than any other state in the union.

California even edged out former No. 1 New York by 7,000 people.

"You think of California as kind of a growing state. And overall, California did gain 
population," said Robert Bernstein, a Census Bureau spokesman. "But (it was) because 
a natural increase and immigration from abroad exceeded the loss to other states."

California has been losing residents to other states each year since the period of 
July 1, 1988, to July 1, 1989, when the outflow began as a trickle.

As of last year, the state's outflow was at its highest point since the mid-1990s, 
when a severe recession and aerospace industry slump drove engineers and other 
professionals out of California in search of work.

Back then, the departures peaked from July 1, 1993, to July 1, 1994, with a net 
outflow that surpassed 400,000 residents.

But instead of returning to California's historical trend of a positive net inflow of 
residents, the outflow has continued nonstop.

And after a lull of a few years, the net departures again seem to be accelerating.

For example, the period from July 1, 2000, to July 1, 2005, saw a net outflow of 
664,000 people from California, an average of nearly 133,000 a year.

That average is about half of the latest figure.

As a percentage of population, New York still has greater outward migration of 
residents to other states than does California.

"But that still begs the question: Why are nearly 240,000 people leaving 
(California)?" said Paul Ong, a demographics expert at the UCLA School of Public 
Affairs.

The current outflow comes at a time of relative economic strength and moderate job 
growth in the state.

In contrast to the recession of the 1990s, this most recent outflow has been driven 
mostly by an economic boom.

The housing boom has made buying a home or even renting much more expensive than just 
a few years ago. That has inspired many of the state's residents to eye cheaper homes 
in other states while giving pause to those considering a move to California.

"California is an extremely expensive place to live, particularly compared to some of 
the markets close by like Phoenix or Las Vegas, (where) you can get a lot more house 
for your money," said Steve Cochrane, senior managing director of Moody's Economy.com 
in Westchester, Pa.

In July, the median price for an existing, single-family detached home in California 
was $567,360, according to the Los Angeles-based California Association of Realtors. 
The figure for Torrance was $610,000.

For California, Torrance and many other cities statewide, you would have to go back 
only five years to find prices at half their current value.

This has made otherwise robust home appreciation in other parts of the nation look 
downright meager.

"Look at San Francisco and parts of Los Angeles," Ong said. "If you look at the last 
decade or so, the people who can afford to stay tend to be better educated and higher 
income. It's driving out working-class people with children. They're moving to the 
suburbs. Some of that must spill into moving to other states."

As a result, Los Angeles County saw a net outflow of 154,320 residents to other 
counties from July 1, 2004, to July 1, 2005, according to the Census Bureau.

Ong added that even with the current slowdown in home appreciation, the damage 
already has been done since the prices have reached a "very high plateau."

California's high cost of living may help explain why about four in 10 Nissan 
employees followed their jobs out of state when the company's North American sales 
and marketing headquarters moved from Carson to Nashville over June and July.

So, where are Californians moving to?

From 1995 to 2000, the most recent period with available statistics from the Census 
Bureau, the top destination state was Nevada. Arizona came in second, followed by 
Texas, Washington state, Oregon, Colorado and Florida.

Each of these states had a positive net migration of residents into their borders, 
according to the latest census figures. Most are relatively close to California. And 
all are less expensive.

That's good news for Jason Braford, ZipRealty's Las Vegas district director.

"We're seeing a continual influx of people from California," Braford said. "The 
lion's share are people coming in from California."

Home prices, lower taxes, shorter commutes and a burgeoning community in Las Vegas 
entice many Californians, Braford said.

"In California, you can (sell) your $500,000 or $600,000 property, you can come here 
and usually you get something that's in the $300,000 to $400,000 range and gain in 
lot size," Braford said.

In addition, people moving from the East Coast and Midwest in search of a warmer 
climate usually first look either to Los Angeles or Las Vegas, Braford said. But 
often Las Vegas wins out because of California's higher cost of living, he said.

A survey conducted by UCLA demographers found that most Southern Californians still 
see this region as attractive. The top three positive elements cited were the 
weather, economic opportunity and cultural diversity, said Ong, who worked on the 
survey.

"Transportation and traffic emerged as the least attractive aspect of Southern 
California," Ong said.

Pollution, crime and public schools also were viewed as problems.

"We've reached the point where our amenities are being outweighed by some of the 
perceived costs -- air pollution, crowding, congestion and so forth," Ong said.

In addition to so-called "push" forces such as high home prices that make California 
seem less hospitable, a big "pull" comes from other states, Economy.com's Cochrane 
said.

"The rate of growth of employment in California is OK, but it's not great. It's 
average at best," Cochrane said. "There are a lot more fast-growing areas (like) 
Arizona, Nevada, Colorado, Utah, Washington state. And increasingly, Texas is back on 
its feet.

"So, for economic reasons, there's a pull from the surrounding region because of 
employment opportunities, and there's a bit of a push from California because of the 
expense of staying in California."

Despite California's net loss of residents to other states, in a seeming 
contradiction, the Golden State remained No. 1 in attracting foreign immigrants, 
drawing about one in every five entering the U.S., according to Office of Immigration 
Statistics figures for Oct. 1, 2004 to Sept. 30, 2005, the latest available.

Indeed, California's 232,000 foreign newcomers in that period were nearly double that 
of the second top immigrant magnet, New York.

California's ethnic diversity is a big reason for the attraction despite the high 
cost of living, Cochrane said.

"Migrants go where there's a place to live and where there's a support system," 
Cochrane said. "And certainly all of California, and L.A. in particular, provide that 
for migrants in many regions of the world."

Another reason for California's popularity with immigrants is the state's massive 
economy that offers vast job opportunities, Cochrane said.

He added that coastal cities such as Los Angeles traditionally have served as points 
of entry for foreigners.

California's immigrant inflow plays an especially critical role, given the state's 
outflow of residents to other states, Cochrane said.

Notably, the number of immigrants admitted to the state from Oct. 1, 2004, to Sept. 
30, 2005, almost equaled the net loss of residents to other states from July 1, 2004, 
to July 1, 2005.

California's immigrant infusion appears to effectively nullify the population loss to 
other states, in terms of numbers.

That reality bears heavily on the state's economy, Cochrane said. The pace of 
economic growth is based partly on the work force's rate of increase. A slow rise in 
the work force's size could stunt economic expansion by limiting the labor supply.

"California depends so much on international migration, particularly to maintain 
positive (economic) growth," he said.

Friday, September 15, 2006

Notes from my housing bubble scrapbook

I love being a collector of real estate paraphernalia and taking the pulse and temperature of public psychology in this crazy market! This week another good sentiment indicator literally landed on our apartment doorstep - more real estate brochures.

I've gotta say, there are some realtors out there who are pretty astute and hustling while there are some markets still worth hustling. Take a look at the invitation we received below to attend a real estate talk at a local Redondo Beach realtor. These flyers showed up yesterday, the 14th. I couldn't help but notice that the line "Please RSVP by September 15" had a line drawn through it. A good Redondo Beach realtor right now, this minute will need to welcome potential buyers with open arms, RSVP or no!

The thing that leaped out at me with the second flyer below is that none of the properties being touted are in north Redondo or any of the other highly desirable beach cities. Nope, they are in the "affordable" areas, like Gardena, Lawndale, and Inglewood, where the markets are still hot. I've blotted out the agent's name, but that realtor is pretty smart striking while her housing market is still thriving, fishing for buyers in the areas where they are priced out. Don't get me wrong. I'm not about to buy that crappy box for $3/4 of a million. But these affordable markets are the last strongholds. Their strength will probably start turning down soon because the properties are at equally preposterous valuations and buyers will soon come out of their comas and realize that, so the realtor probably figures she better rake it in while she can.

Today I checked the sales for 90278 (north Redondo) in Melissa Data for September. To put it mildly, Redondo sales suck. Then I checked 90260 (Lawndale). The Lawndale market is still on steroids. Realtors are still making a good living in places like Lawndale.

I imagine we will be seeing some in the real estate industry in the same predicament as the fellow in the cartoon below. Should that happen, let's try and be charitable. If it's as bad as I think it could get, people in many industries, not just real estate, will be hurt, even those who have been watchiing this coming and have taken steps to try to protect themselves from the economic mess we are in. We'll be infinitely better off if we try to be nice to each other.

On another note, I've been doing some research into foreclosure activity in this area. What I am turning up is not so much a proliferation of foreclosures as there are delinquent taxes. Yes, the property across the street from me with the "alien realtor" could be a tax delinquency, rather than an outright foreclosure. Now why anybody would put in a heroic struggle to make their house payments, but neglect their property taxes, is a mystery to me. I guess coming up with an extra $3K-$4K annually on top of the monthly $4K+ payments is a bit much. It doesn't sound they build the property tax payment into the monthly mortgage payment the way it was done when I once owned a condo many years ago. But stopping property tax payments is just an alternate path to the same destination (loss of home), isn't it?

The market ain't dead yet; some flipper suckers must still be standing. There will be yet another real estate wealth expo in Anaheim this November, with Donald Trump of course. Note that the keynote weekend pass is marked down to $129 from $179. Also be sure to check out the hot blonde babe in the left column talking about her passive six-figure income!

Actually, attending a real estate expo would be kind of fun, it's just not an immediate priority for me. I don't recognize the names of any other speakers. I actually have a grudging respect for Trump - from what I've heard of him and read about him, he's a great project manager - just a lousy market timer. Maybe if one of you bubble blog readers decides to attend, you can give the rest of us a full report.

Thursday, September 14, 2006

L.A. Times: SoCal Home Sales Eroding

This September 13 L.A. Times short piece by Annette Haddad continues to document the ongoing housing market decline, focusing on San Diego and Los Angeles counties.

The Southern California housing market has contracted to its lowest level in six years, and San Diego has gone deeper in the negative. There are now so few buyers in the Los Angeles market that the August sales volume of 9,193 is a level not seen since August 1997. Sales volume is down 21% YOY.

Although the Southern California median home price in August rose 4.7% over August of 2005 to $517,000, the median price has been virtually flat across June to August.

San Diego County continues to lead the way over the cliff. There, the median YOY price is down 2.2% to $482,000, which was the median around March 2005. That was also the biggest % decline since December 1995, towards the tail end of the preceding down trend. August is the third straight month of depreciation in San Diego.

Well the real estate analysts will find something to cheer about. It turns out sales volume did pick up over July in Los Angeles and San Diego counties. One analyst notes that this could be the "last blast" from buyers before the school year started, but then claims that if the trend persists, we are in for a "soft landing".

Arrgghh!! How long will it be before "soft landing" is stricken from our vocabularies!?!?!

Sunday, September 10, 2006

L.A. Times: Buyers play wait and see - staying on the housing-market sidelines can make or break you

It's really amazing how much there is still this "buyers who wait will be losers" and "soft landing" mentality out there, as evidenced by this September 10 L.A. Times article by Michelle Hofmann. Even would-be buyers who are waiting admit they are gambling by "rolling the dice."

We've heard this message before in July, but perhaps the "buyers who wait will be losers" voice is a bit shriller and more insistent now.

The article describes a few successful gamblers who found a decent property, rennovated, and now, based on "comparable prices and recent market sales", figure their homes are worth much, much more. It then goes on to describe those poor unfortunates who sold their properties early and then "got stuck" waiting when the "window of opportunity slammed shut." One realtor who does not advocate market timing (what realtor does?) cautions that when the market "hits bottom", "don't you think that everyone is going to start jumping on the bandwagon? ...if you've seen a home you like that has gone down in price, why not get in the ballpark?"

The article mentions the San Francisco Bay area housing market boycotter Boycott Housing. The website editor is a firm believer that the housing market will mimic what happened to the dot-coms of 2000 following the tech stock mania. Be sure to give that site a visit!

DataQuick, unfortunately, still does not see the potential danger that lies ahead for homeowners. Although the firm's analyst concedes that about 1/3 of listings are "wildly overpriced", and "all kinds of people are trying to gain the peak of the market by putting properties on the market at fantasy prices", apparently he is dismissive of any comparisons to the dot-com stock crash, arguing that houses are not bought and sold as easily, and then goes on with the "buy and hold for the long term" argument that stockbrokers love to use.

Additional note: One of the lucky gamblers mentioned in the article who rennovated a property and now thinks it is worth much, much more lives in Woodland Hills. According to Melissa Data, sales volume in 91364 was comparable YOY until July, when it really started to slump. 91367 has been an area on steroids, but sales volume contracted significantly in August. September so far is not shaping up to be any better. It'll be interesting to see how a rennovation gambler's luck holds out. I find the "buy a property cheap and rennovate it" argument very similar to the value stock buying mentality, which has some merit. Unfortunately, the tricky part comes in knowing what constitutes good value. Our perception of value tends to change over time, and can change overnight in a "market crash" scenario, and therein lies the trap.

Saturday, September 09, 2006

L.A. Times: Standard Pacific Homes Abandons Downtown L.A. Condo Deal

Is this the shape of things to come? We already know from a previous blog entry that downtown is suffering from a glut of condos. Now, according to this September 6 story by Annette Haddad, Standard Pacific Homes, perhaps wisely, has given up on a downtown condo project deal.

The condo project, owned by Lincoln Property of Dallas, will change direction and the condos will be converted to apartments. The $600K+ asking prices failed to attract enough buyers in the 272 unit project, by Union Station. The project had actually started out as an apartment project in early 2005, but Standard Pacific made a deal with Lincoln to sell the units as condos instead. Now the company has changed its mind. Deals that made sense over a year ago "no longer make business sense."

Developers have added nearly 6900 condos and lofts to downtown in the last five years, and 5600 are scheduled to be built over the next two years. Los Angeles area economist Jack Kyser suggests that perhaps downtown "has gotten a little ahead of itself."

Not all downtown condo projects are fairing poorly. Some developers carefully presold their units. Million dollar penthouse units by another developer that have been withheld from the market now have waiting lists.

It'll be interesting to see if we continue to see a "back to apartments" movement develop, given the condo glut. That would probably at least be step closer to sanity and a greater supply of relatively affordable housing, at least.

Monday, September 04, 2006

L.A. Times: Anxiety Complex - "It's hard to accept that prices are going down"

This September 3 L.A. Times article by Diane Wedner gives us a snapshot of our real estate market psychology.

The Los Angeles/Long Beach/Santa Ana area was the second most expensive condo market in Q2 2006. The median price of a a condo in all of Southern California in July was $404,000, up just 2% YOY, showing quite a slowing in appreciation. In July 2005, condos had appreciated 16.8% YOY.

In the early 90's downturn, condos dropped like single family homes, then initially got overlooked in the recovery as SFRs were now more affordable. But they tend to be more affordable than SFRs, and they are popular with young professionals and wealthy older buyers who want to downsize.

As we stand now, there is a ton of condominiums out there in the market, but there aren't that many buyers. The buyers have the luxury of waiting, and they are waiting for "great value".

One agent tells the story of a homeseller (flipper?) who bought her downtown L.A. condo in November 2005 for $385,000 then wanted it listed in early July for $485,000. The agent warned the woman she would need to reduce the price, which she did - to $450,000, then $419,000. The agent urged her to stand apart from the other units for sale in the building by reducing the price to $395,000, but she refused. The listing expired and the place went unsold.

Another realtor tells us that the "days of multiple bids are over", but there still places where condos are disappearing in three days, attracting those young professional and older move down buyers.

The housing experts say "in spite of the doom-and-gloom worries", the housing market is in "better shape than it was 15 years ago during the recession", with "supply and demand more balanced". The bulging baby boomer demographic that wants to downsize apparently has builders still busy, although "...many projects that developers swore would go ahead this year in Orange and San Diego counties appear not to be going forward...", according to one economic research director for one realty. One builder says that he wants "...to see the land prices dip more before I make future land purchases."

Wow, there is still a lot of complacency out there, isn't there? Hope is a difficult thing to let go of. It's a sharp contrast to the opinions of those like Nouriel Roubini, one of the biggest housing bears out there.

Sunday, September 03, 2006

Real Estate $$$ Transacted through August 2006 for Beach Cities

If you are new to this blog, you are now learning that around the beginning of every month, we publish performance charts for the prior month by zip code of real estate $$$ transacted. These are not average price charts. You can find out more about these charts (and our interpretation of the data) here.

Toward the end of August I got the feeling that sales were feebly trying to claw back. The inventory for 90278, at least according to Zip Realty, has shrunk by 5%. But I am also aware of listings in this neighborhood that are not appearing on Zip Realty, so who knows? We'll just have to keep monitoring and see if any uptick persists into September. It would be incredible to believe these local markets could "recover" from the technical damage that has been done to them. The other thing I am noticing is listings by "mystery" realtors from out of the area, which (after discussing in my household) we decided could be signs of foreclosures, but we aren't sure by any means.

I am trying to expand my coverage of this general area. Unfortunately some zip codes have some truly wacky data that I don't know how to interpret, so I will continue to omit those zip codes.

I am also experimenting with an interactive Google Maps tool to give you the same charts. It's still in its infancy, and some of it doesn't work, but you can find it here. Don't be surprised if it's totally unusable while I am debugging it. In the meantime you can find my monthly charts the old-fashioned way.

Here is a ranking of zip code (or groupings of zip codes) by market performance (the YOY % gain/decline on the doubly smooth 3 month moving average):

Real estate on steroids:

90305  387.8%
90301-90305 178.1%  (Inglewood-Lennox area)
90094  73.8%
90302  27.7%
90245  24.9%
90502  22.1%
90504  21.8%
90304  18.0%
90303  17.0%
90301  15.1%
90260  13.3%

Real estate hanging in there:

90250  5.4%
90045  5.3%
90744  4.1%
90501-90505 0.9% (Torrance)

Real estate starting to lose its grip:

90501  -0.2%
90230  -3.6%
90505  -5.8%
90035  -6.0%
90266  -9.9%

Real estate starting to lose the battle:

90503  -16.0%
90066  -17.3%
90292  -19.4%
90277-90278 -19.9%  (Redondo Beach)
90717  -21.0%
beach cities -21.3%  (El Segundo, Manhattan, Hermosa, Redondo)
90278  -23.5%
90291  -29.8%
90232  -30.4%
90401-90405 -33.8%  (Santa Monica)
90034  -35.3%
90064  -36.7%
90254  -38.8%
90277  -38.9%
90293  -43.2%

Wow. In 90277, at least according the %YOY change on the moving average, nearly 39% fewer dollars are being transacted. That is a substantial drop in opportunities to earn real estate commissions. And for the four major beach cities overall (El Segundo, Manhattan Beach, Hermosa Beach, Redondo Beach), real estate $$$ transacted is down over 21% YOY.

Here are the charts for the four beach cities:

Dogmation