Monday, January 30, 2006

Sunday Morning Excursion, January 29, 2006

Sunday was a good day to take our neighbor's dog out for a run to the Redondo Beach dog park, so your faithful beach bubble reporter decided to take a camera along and see what's developing.

Update on 0252 Maharg #10, listed with RE/MAX. It is showing in the Zip Realty listings marked down to $515,000. A markdown of nearly 4.5% is not anything unusual, as we've seen markdowns of over 7% on some condos during the full boom years.
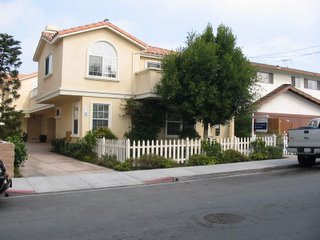
3152 Swehtam Avenue Unit A. Asking price for this condo is currently $785,000, and was just listed at Zip Realty on January 26, 2006.

This complex property was sold in July 2000 to a builder for $310,000, for the construction of three bubbleminiums. The price history since then is as follows:

Unit A Aug 04  $650,000
Unit B Aug 04  $639,000
Unit ? Mar 02  $415,000
Unit ? Mar 02  $432,000
Unit ? Feb 02  $410,000

If the seller were to get the asking price now, that's a 20.7% increase over the August 2004 selling price over 17 months, and perhaps a roughly 85% increase in price over the 2002 selling prices.

0025 Nosnibor Avenue. Asking price for this SFR is currently $1,290,000 for this 3,165 sq ft new "craftsman" home. This has been listed at Zip Realty since October 26, 2005. Prior to this construction was an old postwar house that was sold to a builder in August 2004 for $500,000. (If you click on the picture you'll see my significant other with the neighbor's dog in front of the house.)

Saturday, January 28, 2006

Economist Optimistic about local, California growth in '06

This story was in the print edition of the Manhattan Beach Reporter, volume 29, #51, January 26, 2006. Let's see how good Leslie Appleton-Young's predictions turn out:

Contrary to what some forecasters are predicting about the housing market this coming year, California Association of Realtors Chief Economist Leslie Appleton-Young sees continued, if more modest gains in home prices, and solid underlying economic fundamentals for 2006.

Appleton-Young issued her annual forecast at Shorewood Realtors' monthly meeting held January 11 at Trump National Golf Club in Rancho Palos Verdes.

Rather than experiencing a "bubble", Appleton-Young sees a soft landing for what has been until recently a torrid housing market in Southern California. She noted that regional employment remains strong, with nearly 81,000 jobs created last year; mortgage rates remain relatively low by historic standards; and demand still outpaces supply.

"The economy and employment are growing at good rates -- not great, but sustainable," she said. "Consumer prices, if you subtract oil and food costs, haven't increased very much.

"Overall, consumers are feeling better and spending was robust during the last cycle," she added. "A lot of that had to do with housing price appreciation, which created a lot of wealth. As this appreciation moderates, we may see less spending and definitely less refinancing activity."

The median price of a home last year stood at $548,000 statewide and $575,000 in Los Angeles County. Locally, the median stood at $982,500 in the beach cities (up 23.6% from the previous year) and $1.35 million in Palos Verdes Estates (up 37.8%).

For 2006, Appleton-Young forecast what she called "sustainable, moderate growth" in housing prices, with the statewide median price expected to rise to $573,000. She also said employment and real personal incomes were expected to grow this year, by 1% and 3.6% respectively. Mortgage rates may rise slightly due to expected interest rate increases by the Federal Reserve, but will still remain low by historical standards, with fixed-rate 30-year loans available for around 6.5%.

She also forecast that home prices in Southern California coastal areas would increase from 6% to 12% over the next 12 months.

Appleton-Young said that, for many first-time home buyers, California would remain a tough market to break into, with the "affordability index" - the number of households that earn enough to purchase a median-priced home - standing at 15% statewide and only 12% in Los Angeles County.

Friday, January 27, 2006

Fusion Madness grips the South Bay

I got this email from a reader, whom I won't name to respect his privacy:
I saw your post on the housing blog and just wanted to chime in. I was originally forty-something on the list to buy at Fusion, but I felt that buying a unit there as an investment property wasn't a good idea.... so I stopped showing up for the phase releases and as a result, they kicked me off the priority list. About one week after the list started, there were over 700 people on the list to purchase. Every once in a while I stop by the site to check on the prices and they have increased about 25k for some units (plans C and D) since phase I. So there appears to be enough demand there to justify increases with every release. Yes it's crazy and stupid.
I was pretty sure starting low-end prices were originally in the high $400,000s, now they are at $509,000, confirming what my contributor stated.

Thursday, January 26, 2006

Sales "take a holiday" in December: Shorewood

According to Shorewood Homes,
Continuing to reflect a market in transition, South Bay home sales took a pronounced pause for the holidays, with only 115 homes changing hands during December in the cities of El Segundo, Manhattan Beach, Hermosa Beach and Redondo Beach, according to the monthly Shorewood Report. That figure was off nearly 44% from the 205 homes that sold during December 2004 and represents a 12-month low. At the same time, the number of homes put on the market rose nearly 24%, to 307 last month compared to 248 homes offered for sale during the same month last year.
Number of homes for sale:  307  vs. Dec 04   248  (+ 23.8%)
Number of homes sold:      115  vs. Dec 04   205  (- 43.9%)
Number of sales pending:    92  vs. Dec 04   140  (- 34.3%)          

For sale avg price:  $1,386,000 vs. Dec 04  $1,203,000 (+ 15.2%)
Sold avg price:      $1,058,000 vs. Dec 04    $936,000 (+ 13.0%)         
Sold median price:     $875,000 vs. Dec 04    $785,000 (+ 11.5%)

Sold avg $ per s/f:        $564 vs. Dec 04        $489 (+ 15.3%)

Days on market avg:          36 vs. Dec 04          35

-- For sale by price range:

Less than $500,000           13 vs. Dec 04          13
$500,000-$749,999            53 vs. Dec 04          43
$750,000-$999,999            91 vs. Dec 04          89
$1,000,000-$1,499,999        66 vs. Dec 04          46
$1,500,000-$1,999,999        34 vs. Dec 04          36
$2,000,000 and above         50 vs. Dec 04          21

-- Sold by price range:

Less than $500,000            4 vs. Dec 04          14
$500,000-$749,999            24 vs. Dec 04          74
$750,000-$999,999            43 vs. Dec 04          61
$1,000,000-$1,499,999        29 vs. Dec 04          30
$1,500,000-$1,999,999         7 vs. Dec 04          20
$2,000,000 and above          8 vs. Dec 04           6

Tuesday, January 24, 2006

Recent sale price updates

I just thought I'd update the price histories on some of the recent entries in my stack of sales brochures that I've literally been keeping for years. As I've said in a prior post,addresses are scrambled to protect the privacy of the guilty (and the innocent). I think some of these price histories back up my belief that our South Bay bubble is actually several years old:
0162 Maharg #B, listed at $735,000:

Unit A - May 05 $700,000
Unit B - Sep 04 $659,000
Unit C - Jan 04 $595,000

It's not clear what happened to this development in 2003, but
Domania lists these earlier prices:

Dec 02 - $474,000
Dec 02 - $475,000
Nov 02 - $479,000
Mar 02 - $485,000

0252 Maharg #10, listed at $539,000:
(This doesn't look like it is sold yet.  Offered by RE/MAX.)

0252 Maharg #6, listed at $539,000:
(Originally was listed for $549,000 through Help-U-Sell but relisted for $539,000.  Does not appear to be sold yet.)

Unit 1  - Sep 04 $474,000   
Unit 3  - Sep 04 $455,000
Unit 7  - Sep 04 $495,000
Unit 4  - Jul 04 $475,000 
Unit 13 - Nov 03 $415,000
Unit ?  - Oct 02 $334,000 
Unit ?  - Jan 02 $277,000 
Unit ?  - Nov 01 $266,500
Unit ?  - Aug 01 $265,000
Unit ?  - Mar 00 $207,500
Unit ?  - Oct 99 $209,000
Unit ?  - Sep 99 $203,000
Unit ?  - Apr 99 $195,000
Unit ?  - Apr 99 $204,000 
Unit ?  - Apr 99 $205,000 
Unit ?  - Jul 98 $203,000 
Unit ?  - Jun 98 $192,000

1252 Setag #A, listed at $835,000 (seller motivated):
Unit A - Dec 05 $807,000
Unit A - Mar 03 $560,000
Unit ? - Aug 02 $570,000
Unit B - Mar 00 $450,000
Unit ? - Nov 98 $226,000 

2052 Swehtam #3, listed at $595,000:
Unit 3 - Sep 05  $580,000
Unit ? - Sep 02  $364,000
Unit ? - May 01  $305,000

Will a burst housing bubble lead to social problems?

We could be seeing a rerun of this movie soon. Here's a quote from the September 26, 1990 Wall Street Journal, as quoted in the book Prechter's Perspective. The Wall Street Journal quotation describes Los Angeles area homeowners. Prechter suggests from the last paragraph that denials of financial danger can lead to serious and dangerous social problems.

"It's gotten to the point where we can't even sleep at night," said Darryl Jackson, who has been trying to sell his house for nearly six months.

Jackson and his wife, Debbie, are suffering from what some realtors have dubbed the "home sellers' blues" - a sad litany of frustration, anxiety, desperation, and even anger.

It's a tune that's being sung by hapless would-be sellers in many parts of Southern California, with backup vocals provided by millions of home-owners in depressed housing markets across the nation.

Sleeplessness. Headaches. Upset stomachs and - as one would-be seller puts it - "a general state of disorientation. I think about it when I'm at work. I think about it when I'm cooking dinner. I think about it when I go to sleep at night.

"It's all just sort of hovering there. I feel like I'm in a twilight zone."

"Frustrated sellers are angry at the world, and they want to place blame on somebody for their problems," said Irene Goldenberg, a family psychologist and professor at UCLA.

Wednesday, January 18, 2006

Dataquick - Southland home sales down

According to DQNews, home sales in southern California fell to their lowest level in four years in December 2005. The median price for a SoCal home in December 2005 was $479,000, up 13% YOY. Number of homes sold is down across the board, except for the Inland Empire.

According to DataQuick, signs of distress in the housing market are largely absent. Foreclosures have edged up very slightly but still near lows.

Here are the numbers:

 All Homes     No Sold No Sold Pct.   Median Median  Pct. 
               Dec-04   Dec-05 Chg.   Dec-04 Dec-05  Chg.
Los Angeles    10,242   8,845 -13.6%  $418K  $490K  17.2%
Orange County   4,214   3,826  -9.2%  $551K  $621K  12.7%
San Diego       4,807   4,262 -11.3%  $491K  $516K  5.1%
Riverside       5,412   6,305  16.5%  $371K  $411K  10.8%
San Bernardino  4,334   4,580   5.7%  $281K  $361K  28.5%
Ventura         1,308   1,134 -13.3%  $522K  $630K  20.7%
So. California 30,317  28,952  -4.5%  $424K  $479K  13.0% 

Friday, January 13, 2006

Golden State's Platinum Housing

An article from the Los Angeles Daily News reports that housing affordability across California sank an annual 5 percentage points in November and dipped to record lows in seven areas, including Los Angeles County, according to the California Association of Realtors.

In Los Angeles County, the median-priced home cost $575,310 and only about 11% of households could afford it. A California family needed to earn at least $133,390 a year to get a 6.26% loan to buy a median-priced home. That's assuming a 20% down payment.

In the opinion of your host, measures of affordability could prove to be a good indication of where the real estate market is headed. According to this article, the previous record low in affordability was 13%, hit twice in 1989. For those of you who have been around a while, that was just before the housing market took a bad dive in California in the first half of the '90s.

Realtors quoted in the press still refuse to entertain the possibility of price declines:
I think [affordability] is going to deteriorate further. I know we're going to get higher rates, and even though we're seeing slower price appreciation, prices aren't going to drop, at least in my view.

Thursday, January 12, 2006

Shorewood Realtor Inventory, January 2006

Since they put it on their website, I am going to update this post with the daily inventory from Shorewood Realtors, a major realtor in the south bay area of Los Angeles County.

Since 01/31/2006, 25 new home listings, 38 new home sales.
Since 01/30/2006, 22 new home listings, 33 new home sales.
Since 01/29/2006, 23 new home listings, 33 new home sales.
Since 01/28/2006, 24 new home listings, 32 new home sales.
Since 01/27/2006, 24 new home listings, 35 new home sales.
Since 01/26/2006, 27 new home listings, 40 new home sales.
Since 01/25/2006, 30 new home listings, 42 new home sales.
Since 01/24/2006, 28 new home listings, 47 new home sales.
Since 01/23/2006, 28 new home listings, 57 new home sales.
Since 01/22/2006, 33 new home listings, 58 new home sales.
Since 01/21/2006, 36 new home listings, 59 new home sales.
Since 01/20/2006, 39 new home listings, 57 new home sales.
Since 01/19/2006, 39 new home listings, 55 new home sales.
Since 01/18/2005, 40 new home listings, 56 new home sales.
Since 01/17/2005, 36 new home listings, 54 new home sales.
Since 01/16/2006, 37 new home listings, 38 new home sales.
Since 01/15/2006, 42 new home listings, 38 new home sales.
Since 01/14/2006, 40 new home listings, 37 new home sales.
Since 01/13/2006, 38 new home listings, 28 new home sales.
Since 01/12/2006, 43 new home listings, 21 new home sales.
Since 01/11/2006, 46 new home listings, 15 new home sales.
Since 01/10/2006, 44 new home listings, 21 new home sales.
Since 01/09/2006, 47 new home listings, 22 new home sales.
Since 01/08/2006, 49 new home listings, 21 new home sales.
Since 01/06/2006, 44 new home listings, 25 new home sales.
Since 01/05/2006, 46 new home listings, 24 new home sales.

Tuesday, January 10, 2006

Scaling down getting trendy?

A January 8 LATimes article called The Upside of Scaling Down almost makes it sound trendy to scale down to a tinier dwelling.

Of note:
"It wasn't that the other place was so expensive. It was just too big, and I didn't want to get lots of stuff just to fill the space. I don't need that much stuff just to make me happy."


Geesh, what will happen to our consumer-driven economy if everybody starts thinking like this?!?!!

In the meantime, watching for signs of a bubble bursting in my neighborhood is like watching paint dry.

Friday, January 06, 2006

Beach City Home Prices, 2005

The following data was published in the South Bay Easy Reader, though it does not appear in the online edition. According to the paper the data comes from melissadata.com.

(Prices in thousands 000)

            BEACH CITY HOME PRICES 2005

     Hermosa Manhattan SoRedondo NoRedondo  El Segundo
Jan  $1,052   $1,274      $913      $670     $679
Feb  $1,059   $1,459      $724      $693     $610
Mar  $1,155   $1,380      $814      $767     $695
Apr    $928   $1,510      $815      $748     $675
May  $1,019   $1,399      $920      $757     $770
Jun  $1,167   $1,548      $814      $741     $919
Jul  $1,352   $1,533      $803      $776     $731
Aug  $1,323   $1,516      $848      $730     $896
Sep  $1,074   $1,752      $936      $761     $837
Oct  $1,259   $1,646      $889      $839     $849
Nov  $1,282   $1,568      $901      $788     $916
Dec  $1,446   $1,770    $1,010      $818     $863

     +37.4%   +38.9%    +10.6%     +22.1%    +27.1%  

I added in the percentage gains there at the end.

Still haven't seen visible signs of distress in my neck of the woods. Not yet.

Wednesday, January 04, 2006

California Building Industry Association data

For all you Angelenos,, here's a nice chart from the CBIA that clearly shows why you are feeling squeezed (it's a PDF, so make sure you have Adobe Acrobat). Just 10-11 years ago, over 40% of southern California homes were considered affordable for families with a median income. In 2000, the number dropped below 40% and after a weak bounce, has been plummeting down since. It is currently around 4-5%.

Angelenos aren't the only ones squeezed - Riverside had an even steeper fall (from 65-70% down to about 10%). San Diego's graph is roughly comparable to the Los Angeles one.

The national graph starts in the 60% range and declines to just above 40%. There may be a national bubble, but we got a big bubble here.

And here's another CBIA pdf showing November housing starts. In the Los Angeles - Long Beach area, they are clearly down by 19.2% YOY.

Gotta love press releases. The CBIA says,
The slowdown in November will give builders an opportunity to clear out their standing inventory.

Tuesday, January 03, 2006

California Train Wreck

According to Bob Chapman's International Forecaster Train Wreck of the Week (December 27, 2005),
Even though new homes are selling well new home inventories are the highest in history. It now takes twice as long to sell a house in California as it did a year ago and in Orange County, the sale inventory is five times what it was a year ago.
and...
Seventy-two percent of homebuyers in California over the past two years are spending 40% of their total income on debt service. That is ominous when California real estate is over valued by 45%.
Personally I think that some California real estate is overvalued by far more than that. And while things feel a bit slower in my neck of the woods, there aren't hard signs of trend turnaround ... yet. I remember the early 1990's, and the forest of "For Sale" signs I saw in some neighborhoods. We're not back there - not yet.

Sunday, January 01, 2006

History of 0212 Ruofud Street

This block of condominiums are what would be considered among the most affordable properties in Redondo Beach (not counting the very old post-war style box houses). The complex is quite big and difficult to capture in a ground photo. The picture here only points toward one tiny corner of the complex. The two red arrows are pointing to two For Sale signs. I was standing in front of and just to the left of the main foot entrance when this picture was taken, and the property extended behind me for at least the distance here shown in the photo.

I'm not even sure how many condos there are in the complex. In square footage they range from about 1227 to 1368 square feet.

It's incredible to believe that a property in this complex was selling for $147,000 back in July 1998. Asking prices for those two properties for sale (January 2006) are $579,000 and $587,000.

History of 2102 Swehtam Lane

The earliest history I could find on this property was 2001. There are three townhomes on the property. This is actually on the nicer side of north Redondo, and this section of the street is more tree-lined than most of the rest of the neighborhood, giving it a nice cool feel in the summer.


Here is the valuation history I could find:
         Sep-2001  Dec-2001  Nov-2004  Mar-2005  Apr-2005  Dec-2005*
 Front   $435,000                                $716,000
 Mid     $397,000                      $680,000       
 Rear              $435,000  $710,000                      $995,000

* The rear unit is currently for sale. From the sales brochure it sounds like a large deck is what gives this unit its valuation (we won't talk about the crazy things going on with valuation in the synapses of the brains of buyers). Sellers are "very motivated", whatever that means.

History of 2020 Noslen Lane

Whenever I go by this house I always think of that Beatles song "Mean Mr. Mustard". It certainly looks like that he could live here. Actually, this is one of the nicer looking homes in the neighborhood from the inside. When it was under construction I noted the wide hallways and the arches, which I particularly like. The property that was formerly here was sold to a builder in July 2001 for $300,000. Each of the townhomes built sold in September 2002, one for $519,000 and one for $589,000. The property in front is currently (January 2006) is now in escrow, but was listed for sale at $999,900 (call it a megabuck). Only a Hummer will qualify as the transportation mode of choice in this neighborhood. The red arrow points to the matching yellow Hummer owned by the residents in the back. Nope, there ain't hard signs of a slowdown here, not yet.

Dogmation