Real Estate $$$ Transacted through November 2006
First, a few apologies. I discovered some data errors in Palos Verdes (90275), and in Inglewood combined. PV home sales are still severely down, though not quite as much as I thought before. And Inglewood was just a touch more bubbly than I thought.
And now a few announcements. By New Year's I will have drastically overhauled these zip code charts to simplify my work. There are just too many to format at the end of each month. It has been tough making choices between breadth of area coverage and depth coverage but I think with a few changes this will be more manageable for me. I am trying to stick with west of the 110, south of the 10 freeways, since nobody else seems to be doing this area in depth. It's also very obvious that real estate money is draining out of what are considered the more affluent areas and the bubble is still alive in the not-so-affluent areas, so it's important to track these latter areas. However my concentration will remain first Redondo Beach, second, Beach Cities, then the general area last.
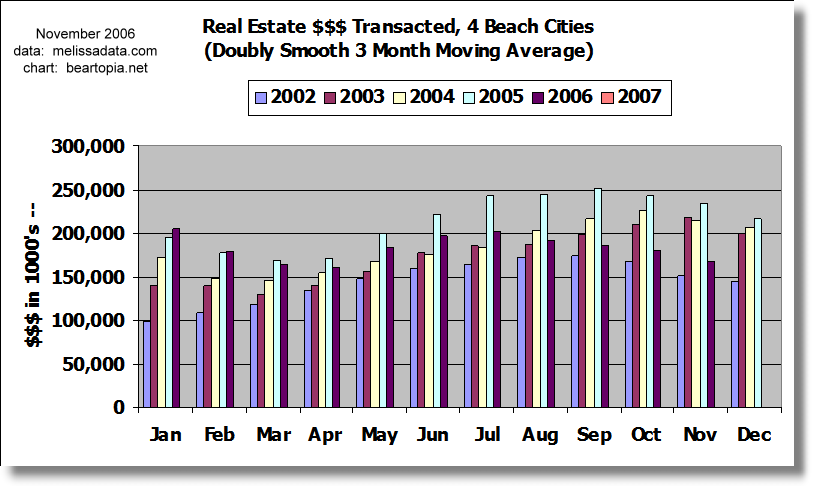
This month I am introducing a new chart to give a trendline view of the doubly smooth moving average. I will be adding the raw trendline to this new chart and then by New Year's do away with the column charts for raw and moving average data. I will also keep the YOY change chart. So eventually each area covered will just get two charts. And we aren't losing any information at all, it'll just be in a different form.
I think the trendline view of the historic data is helpful because then it is easier to see what the YOY gain or loss is based on.
I will discontinue use of the Google Maps tool, since so few people seem to use it. In addition, zip codes will be aggregated into single charts. I will probably discontinue charting individual zip codes for Inglewood and for Torrance.
I haven't decided where to group Palos Verdes (90275) yet. I like lumping it with the Beach Cities but the beach city collection as it is now corresponds to what Shorewood Realtors reports, and I'd like to match that.
The aggregation will (tentatively) be as follows:
- Beach Cities - stays the same, may add PV: 90245, 90254, 90266, 90277, 90278
- Culver City: 90230, 90232
- Inglewood/Lennox - discontinue individual zip codes: 90301-90305
- Hawthorne, Lawndale, Gardena: 90250, 90260, 90249
- Ladera Height, Baldwin Hills, Leimart Park: 90008, 90056
- Mid City: 90016, 90018
- Redondo Beach: 90277-90278
- Santa Monica - stays the same: 90401-90405
- Torrance - discontinue individual zip codes: 90501-90505
- South Central (west of 110): 90007, 90037, 90043, 90044, 90047, 90062
- Westside - Palms, Rancho Park, Mar Vista, Venice: 90034, 90064, 90066, 90291
- LAX Westside - Playa Vista, Marina Del Rey, Playa Del Rey, Westchester: 90094, 90292, 90293, 90045
- San Pedro, Lomita (maybe PV): 90732, 90717, maybe 90275
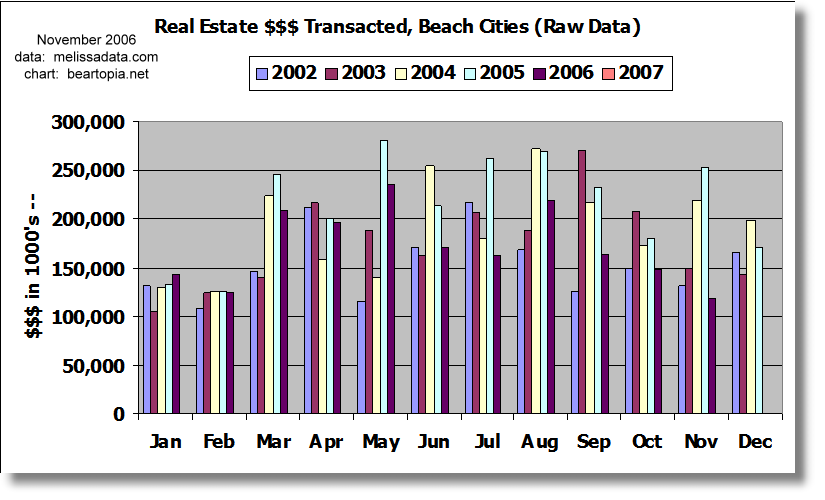
Now, on to this month's data:
There was a last minute clump of sales entered on December 1 into Melissa Data, that maybe doubled what had been in place up to November 30 for the beach cities. Even so, $$$ volume, to put it nicely, looks terrible. It'll be obvious from the new chart that we had no summer selling season to speak of, and any little itty bitty bounce we're getting now is pretty pathetic.
The new chart makes clear how seasonal real estate is in the beach cities. Keeping in mind that this is a double smoothing on a 3 month moving average, we know then that instead of peaking around October, as the charts show the previous few years, the seasonal peaks really come a few months earlier than what is shown. So our "real" seasonal peak is really July-August or thereabouts.
Taking the new chart at face value, we can see that we hit a slightly lower trough in April-May 2006 than in the corrsesponding time in 2005, and that unlike 2005, when sales kept climbing through July and surged into October 2005, July 2006 saw sales severely wilt and start trending down. I'm sorry, Mr. Greenspan and Mr. Lereah, but there's no sign of a recovery here!
You can view all four charts below blown up on one page.


Listed below is %YOY change on the moving average in the individual areas that are charted. Here is the link to the October numbers for comparison:
Real estate on steroids (realtors fat and happy):90305 171.7% Inglewood 90746 32.4% Carson 90301-90305 29.6% Inglewood/Lennox combinedDoing very well:
90037 14.4% South Central
90303 9.5% Inglewood
Hanging in there:
90043 3.4% Hyde Park, Windsor Hills
90260 2.4% Lawndale
90304 1.8% Lennox
90302 0.2% Inglewood
90044 0.1% Athens
Slip sliding away:
90047 -1.7% South Central
90245 -2.7% El Segundo
90301 -3.7% Inglewood
90744 -4.1% Wilmington
90062 -5.1% South Central
90502 -9.7% Torrance
90250 -10.3% Hawthorne
Losing a grip:
90066 -16.4% Mar Vista
90249 -19.0% Gardena
90007 -19.1% South Central
90232 -19.4% Culver City
90501 -19.6% Torrance
90266 -19.7% Manhattan Beach
90016 -20.2% West Adams
90018 -20.3% Jefferson Park
90230 -22.4% Culver City
90045 -22.5% Westchester
90504 -24.8% Torrance
About to go over a cliff (realtors getting hungry:
90277 -26.8% Redondo Beach (south)
90008 -27.0% Baldwin Hills / Leimart Park
90501-90505 -27.6% Torrance Combined
90035 -28.5% West Fairfax
beach cities -28.7% 4 Beach Cities combined
90019 -28.8% Country Club Park/Mid City
90277-90278 -31.3% Redondo Beach combined
90745 -31.6% Carson
90717 -32.5% Lomita
90278 -34.2% Redondo Beach (north)
90505 -35.9% Torrance
90275 -36.8% Palos Verdes Estates
90292 -37.4% Marina del Rey
90503 -38.0% Torrance
90732 -38.2% San Pedro/Rancho PV
90036 -38.3% Park La Brea
90034 -39.0% Palms
90293 -40.9% Playa del Rey
90056 -43.1% Ladera Heights
90291 -46.7% Venice
90064 -47.2% Rancho Park/Cheviot Hills
90254 -48.0% Hermosa Beach
Sliding down a cliff (realtors really hungry!)
90401-90405 -55.2% Santa Monica combined
90094 -55.3% Playa Vista
By the way, even though I don't publish the charts, I do report on the YOY change in $$$ volume in certain zip codes and I will continue to do so.
I will repeat again, this is not price data, this is $$$ volume. Visit our regional real estate $$$ tracker for details on a specific area and a more thorough explanation of these charts.
posted by bearmaster at 3:56 PM
![]()
![]()


4 Comments:
Bearmaster,
As always, nicely done. The steady drain in sales have to be crimping local realtors (tm) lifestyles. And yet, the townhomes keep comming. I grabbed fliers for 1800 PCH yesterday (98 townhomes in Redondo near PV blvd ). Three were for sale and one for lease! Ouch... I noticed 3 were for sale on one flier. Efficient realtor. ;)
Neil
Sounds like the realtors are getting efficient, saving on paper, LOL.
I guess my lifestyle would be crimped too if some 30% of my business shriveled up.
With the dollar volume down 50% and I'll bet the comissions being cut from their levels during the fat years there's got to be some real hungry agents out there.
Today's report on Boston has been released on both my blog and our new website. History has shown us that Boston is a great indicator of what will happen here in California.
thebubblebuster.com
or
Daily Home Price Analysis
Post a Comment
<< Home