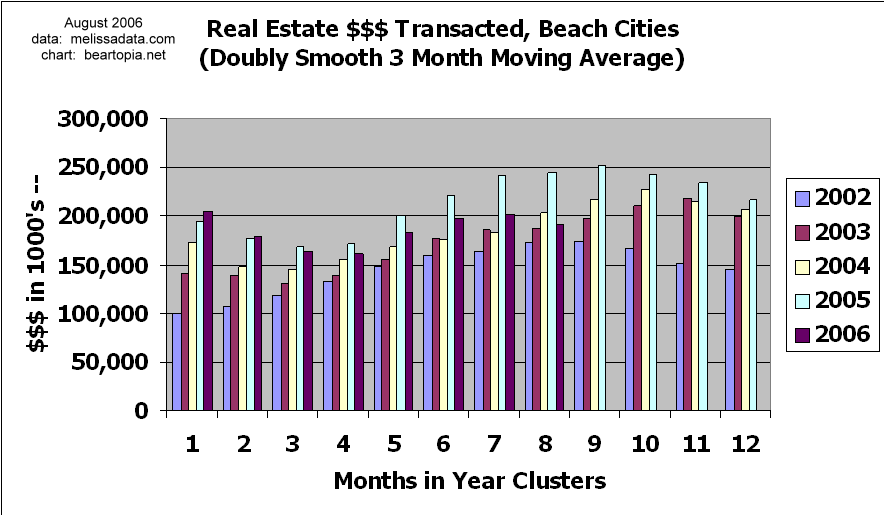
Real Estate $$$ Transacted through August 2006 for Beach Cities
If you are new to this blog, you are now learning that around the beginning of every month, we publish performance charts for the prior month by zip code of real estate $$$ transacted. These are not average price charts. You can find out more about these charts (and our interpretation of the data) here.
Toward the end of August I got the feeling that sales were feebly trying to claw back. The inventory for 90278, at least according to Zip Realty, has shrunk by 5%. But I am also aware of listings in this neighborhood that are not appearing on Zip Realty, so who knows? We'll just have to keep monitoring and see if any uptick persists into September. It would be incredible to believe these local markets could "recover" from the technical damage that has been done to them. The other thing I am noticing is listings by "mystery" realtors from out of the area, which (after discussing in my household) we decided could be signs of foreclosures, but we aren't sure by any means.
I am trying to expand my coverage of this general area. Unfortunately some zip codes have some truly wacky data that I don't know how to interpret, so I will continue to omit those zip codes.
I am also experimenting with an interactive Google Maps tool to give you the same charts. It's still in its infancy, and some of it doesn't work, but you can find it here. Don't be surprised if it's totally unusable while I am debugging it. In the meantime you can find my monthly charts the old-fashioned way.
Here is a ranking of zip code (or groupings of zip codes) by market performance (the YOY % gain/decline on the doubly smooth 3 month moving average):
Real estate on steroids:
90305  387.8%
90301-90305 178.1%  (Inglewood-Lennox area)
90094  73.8%
90302  27.7%
90245  24.9%
90502  22.1%
90504  21.8%
90304  18.0%
90303  17.0%
90301  15.1%
90260  13.3%
Real estate hanging in there:
90250  5.4%
90045  5.3%
90744  4.1%
90501-90505 0.9% (Torrance)
Real estate starting to lose its grip:
90501  -0.2%
90230  -3.6%
90505  -5.8%
90035  -6.0%
90266  -9.9%
Real estate starting to lose the battle:
90503  -16.0%
90066  -17.3%
90292  -19.4%
90277-90278 -19.9%  (Redondo Beach)
90717  -21.0%
beach cities -21.3%  (El Segundo, Manhattan, Hermosa, Redondo)
90278  -23.5%
90291  -29.8%
90232  -30.4%
90401-90405 -33.8%  (Santa Monica)
90034  -35.3%
90064  -36.7%
90254  -38.8%
90277  -38.9%
90293  -43.2%
Wow. In 90277, at least according the %YOY change on the moving average, nearly 39% fewer dollars are being transacted. That is a substantial drop in opportunities to earn real estate commissions. And for the four major beach cities overall (El Segundo, Manhattan Beach, Hermosa Beach, Redondo Beach), real estate $$$ transacted is down over 21% YOY.
Here are the charts for the four beach cities:


posted by bearmaster at 7:43 PM
![]()
![]()


5 Comments:
Thanks to the diligent bubblewatcher who informed me that the Club Condo sign spinners actually appear in the L.A. Weekly.
Soul of the Spin Machine
Now that the hot summer selling season has come to an end it should be interesting to see how prices hold up in the face of resetting ARMs. Keep the great reporting going Bearmaster.
L.A. Renter, do you have any specific zip codes in mind? I have a great deal of consolidated data from MelissaData.com that I don't publish, also the median price data from the L.A. Times and DQNews (which tends to be old), but if you are interested in a few particular areas I could perhaps give you my impression of the data I have.
L.A. Renter, another reason for the slight uptick could be that there is often a flurry of sales at this time of year before the school year really settles in.
I've always thought we've had sort of a "head and shoulders" to our market pattern here - uptick in spring, surge in summer, back down in the fall to form a second shoulder, then down and flat over winter. Only this summer we did not get that surge, so instead of that leveling off it looks like we are getting that fall uptick now.
A friend of mine who comes from a family of realtors told me that May-June and September are often the two prime selling seasons, though with school years now starting sooner than the time when I went to school, that could also be affecting the real estate seasons.
There's a blurb in the L.A. Times about Manhattan Beach as the "sandbox to the stars". Apparently Jeff Garcia of the Philadelphia Eagles has purchased a $2.8 million home in M.B.
This is the reason why I don't chart average prices. A few top-end sales like this make the average price (and the market) look superficially healthy, when underneath there can be something else going on.
Post a Comment
<< Home