Thursday, January 31, 2008

L.A. Times: Homeowner credit evaporates - "if they're upside down we'll definitely cut them off"

The financial system is starting to make the Titanic look like the model of stability. Home lenders are seriously tightening HELOC standards, according to this January 31 article by Kathy M. Kristof and E. Scott Reckard. Sinking values have put many homeowners upside down on their mortgages. Countrywide and others are turning off the cash spigots.

Economist Peter Morici at the University of Maryland says that when credit is contracting, the Federal Reserve's lowering of interest rates is not going to help much. "The Fed is pushing on a string."

Chase Home lending customers this week who were able to borrow 90% of the value of their home will next week only be able to borrow 70% if they live in certain parts of California - care to guess where?

Chase is turning down many many requests for refinancing. It'll be interesting to see how many of those mortgage applications that we've seen surging in the last few weeks really bear any fruit.

Note: I have data collected for dollar volume transactions for January, and I've updated my Excel workbook. However, chart publishing will be slightly delayed because this weekend I will be terribly busy canvassing for Ron Paul before the Tuesday primary. We'll be hitting district 35, which has a relatively low percentage of Republicans compared to district 36 (where I live). We stand a better chance of earning 3 national delegates out of district 35. if you're interested in helping out, check out the Hermosa Beach Ron Paul meetup.

Wednesday, January 30, 2008

More new pack-em-in housing in Redondo Beach

For those of you who are fans of high-density pack-em-in style housing, here's the latest new project for you. It's called Breakwater Village, and it's built by Anastasi. It's got about 190 units. But the community is for seniors. This link also has details.

These are the same senior condos I saw during my visits to Ruxton Lane.

This is located at 2750 Artesia, which is east of Inglewood Avenue.

I live west of Inglewood, 3 blocks from Aviation, and I am aware of another pack-em-in senior project almost directly south of me, also on Artesia. This one is called The Montecito. These are substantially pricier, at least according to the brochure I picked up many months ago and filed away. The Watt Communities website differs, saying that pricing is not yet available.

Is this Redondo's idea of affordable housing? Little boxes stacked on top of each other like a baby's toys? And why is it that only seniors get some crap thing built for them at anywhere close to a reasonable price (though IMO these are still way too pricey..)

Tuesday, January 29, 2008

CAR/DQNews December 2007 report for Redondo Beach

The following figures are from the California Association of Realtors (CAR) for December. CAR gets its figures from Dataquick.

The median price for a Redondo Beach home (new or existing, SFR or condo) is now $732,500 down -0.3% YOY.

My calculation came in a bit high - at $775,000, based on 29 records. DataQuick had 42 Redondo Beach sale records.

For the four beach cities, DataQuick reports a median price of $935,000, up 0.65% YOY, based on 67 sales.

For the South Bay area, DataQuick reports a median price of $632,250, up 3.44%, based on 272 sales.

The median home price in the Westside is $1,575,000, up 74.03% YOY, based on 39 sales. West Los Angeles median price was $775,000, down -2.52% YOY. Palos Verdes Estates recorded a median of $1,127,500, down -18.88% YOY, based on 14 sales, and Palos Verdes Peninsula area recorded a median price of $1,050,000, down -1.87%, based on 35 sales. Malibu is up 4.9% at $1,500,000, based on 11 sales, while Beverly Hills is down -3.44% to $1,641,500, based on 22 sales.

The Westside is still showing some strength, but it looks like weakness is encompassing even the well-to-do areas. Even though they can afford to write checks for their properties, do you suppose that even the wealthy might hesitate before plunking down their cash on a property with all this financial seismic activity going on?

Macromarkets: Los Angeles area median housing price down -11.9% for November 2007

The Case-Shiller index was released for November 2007.

According to the index, Los Angeles area median home price was down -11.9% from November 2006, and down -3.6% from October 2007. To learn more about the Case-Shiller methodology, visit Macromarkets.

Monday, January 28, 2008

Other measures of Los Angeles beach cities market activity, December 2007

Shorewood has published December numbers.

According to Shorewood, December average DOM for the four beach cities has come down to 49, from 65 in December 2006 (the preliminary DOM they had last year was 56, and that was revised). There is no resemblance whatsoever between their official beach city DOM statistics and what I have calculated for Redondo Beach. My last calculation for December was a median DOM of 88 days (nearly 3 months), and an average DOM of 140 days (about 4.6 months). However, my definition of DOM is more precisely defined as "time spent hustling a property", which is not quite the same as days on the MLS.

My homegrown measure of Demand Weakness (or Supply Strength) has dipped for the first time since August - though it's only a slight dip. This is the ratio (inventory - sales) / sales. Shorewood reports 82 homes sold for all the beach cities, compared to 118 in December 2006, and an inventory of 515 compared to a December 2006 inventory of 528. At this time of year we should probably expect a dip in this graph, as listings expire and do not get relisted. Take a close look at this graph, and you'll see that sales relative to inventory was maxed out in the spring of 2005, when I-S/S was roughly 0. This graph has been climbing since.

Median price for the four beach cities was $887,000, up 10.6% YOY. Shorewood made no mention of how high-end, more well-heeled buyers might be skewing that median, and instead said the beach cities remain "a unique marketplace", "people still want to buy homes", and "homes are still selling", despite growing uncertainty due to the turmoil in the housing and financial markets. Shorewood notes the South Bay isn't going through foreclosures at the rate seen in other markets, so that should contribute to price stability, and little new construction is going on, which will limit supply.

This all sounds a little bit like whistling in the dark to me. In addition, my records of unresolved inventory show that almost 20% of unresolved inventory is new construction. The median time on market for this new construction, by my calculations is - get this - 199 days! and the average time on market is 222 days. New construction aligns almost exactly with what I calculated for the bigger general pool of unresolved inventory earlier this month. The builders of these bloated palaces are not doing any better at getting their places sold than most homesellers. And here I thought they would be more practical about cutting prices far enough and quickly enough to move their product, compared to a homeseller with heartstrings tied to his domicile. Well, another theory bites the dust.

Gee, do you think a few builders could be getting themselves in a little financial hot water? The other day, just for the heck of it, I went to my local bank's website and read its Q4 and 2007 earnings statement. For Q4 2007, while real estate loan charge-offs increased YOY from $3,000 (yes, thousand) to $1,570,000, and commercial loan charge-offs increased from $1,985,000 to $7,503,000 YOY, construction loan charge-offs also increased - from $0 to $788,000. We've known the real estate consumer has been in trouble for a while, so the increase in real estate charge-offs is no big surprise, but now it appears that a few builders are not paying their loans. And this is just one measly little bank.

Personally, I think some builders (as well as realtors!) ought to be preparing for some very lean years coming down the pipe. And the worst thing is, if we have any kind of false dawn this spring, fueled by our Federal government monkeying with conforming loan limits and interest rates, a lot of suckers are going to get pulled back in to this maelstrom.

Saturday, January 26, 2008

Uh oh! Conforming loan limits may be boosted!

According to this January 25 story by E. Scott Reckard and Peter Y. Hong, the stimulus plan will provide a year of cheaper loans for Californians buying or refiing higher cost homes. The House and the White House have agreed to raise the cutoff point from $417,000 for loans that would be eligible to be purchased by government-sponsored mortgages.

This is a big step being taken to "stabilize the housing and mortgage market", according to a spokesman at Countrywide, which took a lead in pressuring the politicians to raise the loan limits. (Bleegh!) The California Mortgage Banker Association says "this is a very positive development for California's lenders and homeowners." (Barf!) And CAR is jumping for joy.

At least not everybody is jumping for joy at this strategy of fueling the drug addict with more drugs. Edward Leamer at UCLA points out that the markets have been derailed by bubble-era housing prices and that hasn't changed, adding that a conforming loan limit in the $700,000's is still beyond the reach of most. There is opposition from critics who say the plan shifts the risk from the private sector to the government.

The stimulus package isn't expected to be signed off for about six weeks. We will have time to see if raising the conforming loan limit does anything to Redondo Beach sales this spring.

Friday, January 25, 2008

AFP: Family pets fall victim to subprime crisis; latest foreclosure stats from L.A. Times

As an animal lover, it sickens me to hear or read about the cruelty that humans inflict on their animal companions. The subprime crisis is bringing out the worst in us. The following is a story from Mira Oberman at Agence-Presse France, a global news agency, originally found on Yahoo.

I doubt Southern Californians will behave any differently. Scroll to the bottom of this post for the latest Southland foreclosure statistics, county by county.

A dog looks from its enclosure at a kennel at the Queen Anne's County Department of Animal Service in Queenstown, Maryland, January 24. The most pitiful victims of the subprime mortgage crisis rocking the US are the family pets as people forced out of their homes are giving up their pets. (AFP/Jim Watson)
 CHICAGO (AFP) - Forget about the lost furnishings and finances, the most pitiful 
victims of the subprime mortgage crisis rocking the United States are the family 
pets.

Shelters across the country have seen sharp upticks in the number of people giving up 
their pets in recent months because they have been forced out of their homes.

And -- more tragically -- neighbors, police and foreclosure agents are finding 
increasing numbers of pets left to fend for themselves in abandoned homes.

"We're finding too many animals who have starved to death," said Stephanie Shain, 
director of outreach for the Human Society of the United States.

While some people dump their pets on the street, others go so far as to lock the 
animal in a closet where their cries for help are harder to hear, she said.

It can take weeks for an animal to starve to death and desperate scratch and bite 
marks are usually found on doors and windows.

"They will eat anything -- furniture, or carpet or wallboard -- to try to ingest 
something," Shain said in a telephone interview.

"It's a very fearful and frantic and panicked situation for that animal to be in."

While there are no national statistics tracking how many animals are abandoned or 
dropped off at shelters, Shain said anecdotal evidence has shown "huge spikes" in 
areas hardest-hit by the housing downturn that shows no sign of easing.

Nearly two million families lost their homes to foreclosure in the first 11 months of 
last year after failing to keep up with mortgage payments, a hefty chunk of which 
were subprime loans.

That's an increase of 73 percent compared to a year earlier and represents one out of 
every 63 households nationwide, according to RealtyTrac which tracks mortgage data.

The Humane Society recently instigated a public-awareness campaign to offer tips on 
finding animal-friendly rental housing and remind people that pets are much better 
off in a shelter.

In one of the more shocking stories, more than 60 cats were found abandoned in a 
foreclosed home in Cincinnati last May, shortly after the foreclosure rate began to 
spike nationally.

Twenty of those cats are still being fostered while awaiting a permanent home, 
according to Foreclosurecats.org, a group which launched art projects to help finance 
the cost of caring for the kitties.

Most are not as lucky. Shelters across the country are habitually overcrowded and 
underfunded. Even animals which stand a good chance of being adopted are often 
euthanized in order to free up much-needed space.

That's why one pet rescue group which used to only deal with finding homes for 
hard-to-place strays has started temporarily fostering the pets of owners in 
distress.

"Most of the calls we get are from people who really want to keep their pets," said 
Melanie Roeder, the outreach manager at Chicago's Tree House Animal Foundation.

"We try to counsel them and talk about the idea of fostering, or finding a place on 
their own."

The group took in the cat of one woman who only needed a few weeks to find a new 
place to live and is open to helping others.

For others who are not able to find such a quick fix, saying goodbye is the only 
option.

"It's pretty traumatic for everybody, especially the kids," said Terri Sparks, a 
spokeswoman for Chicago's largest shelter, the Animal Welfare League.

"It's part of the family and they have no other options ... people are telling us 
we're losing our home and have to move."

While moving has always been one of the top reasons why people give up their pets to 
shelters, Sparks said more people started mentioning foreclosures a few months ago.

About 15-20 foreclosed families are now coming into the shelter every week with their 
pets, and police bring in two or three pets a week found abandoned in foreclosed 
homes.

Be sure to check out "Pain Goes Through the Roof", a January 23 story by Peter Y. Hong at the L.A. Times. "Foreclose me!" is becoming the new rallying cry of this generation. Economist Chris Thornberg says "it's clear California has entered a recession...if you think the market's bad now, wait a year."

Here are the foreclosure statistics for Q4, county by county:

Area              Q4 2006        Q4 2007       % Chg YOY
Los Angeles           942          4,536         +381.5%
Orange                327          1,538         +370.3%
Riverside             813          4,520         +456.0%
San Bernardino        463          3,058         +560.5%
San Diego             723          2,296         +217.6%
Ventura               114            542         +375.4%

And here are the top 10 Los Angeles County foreclosure zip codes:

Area             Zip        Q4 2006       Q4 2007       %YOY Chg
Altadena       91001              1            37        +3,600%
Costa Mesa     92626              1            29        +2,800%
Pico Rivera    90660              1            26        +2,500%
Anaheim        92802              1            23        +2,200%
Long Beach     90810              1            20        +1,900%
Orange         92865              1            19        +1,800%
Culver City    90230              1            18        +1,700%
Los Angeles    90016              1            17        +1,600%
Walnut         91789              1            16        +1,500%
Whittier       90605              1            16        +1,500%

Tuesday, January 22, 2008

L.A. Times: State posts record 31,676 foreclosures

Gee, does anybody still really think we're going to be out of this mess by the end of 2009? The number of foreclosures in the golden state in Q4 2007 were more than double the number in the worst quarter of the last downturn, according to this brief January 22 note by Peter Y. Hong.

31,676 homes were lost to foreclosure in Q4, far more than the 15,418 homes lost in Q3 1996. Q4 default notices stood at 81,550, more than twice the 37,994 default notices issued in Q4 2006. It is estimated that 41% of homeowners in default are able to avoid foreclosure by getting their payments current, compared to 71% a year ago.

Price appreciation is definitely a problem for financially distressed homeowners, because there isn't any! The statewide median price was down to $402,000 by the end of 2007, after the March 2007 peak at $484,000. The Southern California peak occurred in the spring and summer of 2007 at $505,000 and ended 2007 at $425,000.

Here are the percentage increases in default notices for Q4 2007, by county:

COUNTY        % INCREASE YOY
Los Angeles        +83%
Orange            +116%
Riverside         +119%
San Bernardino    +106%
San Diego          +95% 
Ventura            +89%

In unrelated news, I would love to hear about what goes on at this upcoming Homebuyers Fair.

Sunday, January 20, 2008

Los Angeles Beach Cities Resale Activity for December 2007

Oops, I forgot to include the numbers for the local zip codes! I've edited them in at the bottom of this post.

December ended up being another nightmare month, and more analysts are finally now conceding that this slump will not end soon, according to the January 16 story by L.A. Times writer Peter Y. Hong. At least, not in 2008. Some analysts push off any sign of a recovery until 2009.

Analysts have remarked that there is "very little discretionary buying", the market is now shaped by "people trying to avoid foreclosure, banks trying unload repossessed homes, and builders who need to move houses." Isn't that cheery?

I'm not sure if I agree with USC economist Gary Painter who claims that "we really didn't have past history to judge what [extremely cheap credit leading to dramatic price leaps as unemployment has held low] would do to housing cycles." He is just now figuring out this was unsustainable?

A Hancock Park agent says sales are stalled out now because "sellers think their houses are worth more than they are and buyers think the market hasn't reached its bottom yet." This agent argues that both sides need to "give up" timing the market. Sellers should cut their prices and buyers should be prepared to "ride out short-term price declines."

Well excuse me, but I think I'll pass.

By southland county, median price for ALL new and previously owned homes sold were as follows:

County            Median $     % Chg YOY     Number sold     % Chg YOY
Los Angeles       $470,000      -10.5%        4,430           -47.8%
Orange            $565,000      -10.3%        1,731           -42.0%
Riverside         $355,000      -17.8%        2,503           -44.9%
San Bernardino    $315,000      -14.9%        1,518           -54.8%
San Diego         $430,000      -13.1%        2,468           -35.4%
Ventura           $525,300      -11.0%          590           -42.3%
SOUTHLAND         $425,000      -13.3%       13,240           -45.3%

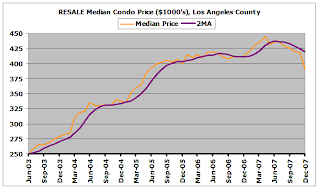
And here are my monthly charts of RESALE (existing home) activity for December. Quite a bit of sag is developing on these charts. Some of these charts contain my own estimates, since 90245 didn't sell any condos in December and 90266 didn't sell condos a year ago. Long-time readers know I don't place much value in these charts.

This table was added after the initial posting.

Here are the detailed RESALE statistics for the beach cities and some of the surrounding zip codes:

                         SFR   MEDIAN    %YOY    CONDO  MEDIAN   %YOY  
COMMUNITY         ZIP    SALES   SFR      CHG    SALES  CONDO     CHG
LA/Westchester    90045   14    $715     -3.2%     1     $447     4.7%  
El Segundo        90245    7    $762     15.5%   N/A      N/A     N/A
Hawthorne         90250    7    $510     -1.3%     2     $440    -1.1%  
Hermosa Beach     90254   13    $900    -33.3%     2     $965    +9.4%  
Lawndale          90260    9    $439    -17.9%     4     $378   -13.4%  
Manhattan Beach   90266   18  $1,250    -10.0%     4   $1,020     N/A  
Palos Verdes Pen. 90274   11  $1,195    -14.0%     4     $447     N/A  
Rancho P.V.       90275   16  $1,175    +17.6%     8     $668    +1.3%   
Redondo Beach     90277   13    $950     +2.3%     4     $705    -9.0%   
Redondo Beach     90278   12    $713     -2.0%    19     $685   -10.8%

Friday, January 18, 2008

South Bay Association of Realtors: South Bay housing market dips, but holds steady

As you can see, south bay home prices by some measures are still retaining their glorious gains from the bubble years. Here is the latest from SBAR (South Bay Association of Realtors).

The median single family home sale price in the South Bay in December 2007 was 
$741,500, a 14.3% increase over December 2006, while the median condominium/townhouse 
sale price was $510,000, representing a 2.9% decrease over December 2006, according 
to the South Bay Association of Realtors.

Market data for South Bay average house prices show a similar trend.  The average 
single family home price in December 2007 was $1,030,252, a 21.4% increase over 
December 2006, while the average condominium/townhouse sale price was $562,062, 
representing a 2% decrease over December 2006.  The average days-on-market was 58 
days, a slight decrease over December 2006.  Additionally, 254 homes soled in 
December 2007 (a 48% decrease over December 2006) and 837 homes sold in the fourth 
quarter of 2007 (a 44% decrease).

"While we are seeing some of the effects of the same downward markeet trend as is 
occurring elsewhere in California, the price of residential real estate has held 
steady or only dipped slightly in comparison," said Carol Olney, president of the 
South Bay Association of Realtors. "Although our sales volume is lower, South Bay 
home sales show a local housing market that is weathering the downturn better than 
are other markets, when we look beyond short-term and seasonal fluctuation."

The median single family home price has shown strong growth, up 15.9% since December 
2005.  The South Bay average home price has historically been much higher than the 
median price, which suggests the market is buoyed by high land values and home prices 
in the beach cities and Palos Verdes Peninsula submarkets.

The median single family home listing price is showing signs of decrease, however, 
down 6.9% over December 2006, and down 13.6% over December 2005.  The median 
condominium listing price has held more steady, showing an increase of 5.1% over 
December 2006 and a 4.6% increase over December 2005.  Nonetheless, both condominium 
and single family home listing prices have held steady when viewed through a 12 month 
moving average, which seeks to eliminate seasonal fluctuations.

Average days-on-market shows a steady climb throughout 2006 and 2007, with the 
exception of a dip toward the end of 2007.

This doesn't tell the whole story of course. Why would asking prices be down if everything was rosy?

Wednesday, January 16, 2008

DQNews: Continued nose-dive for Southland home sales

Before I forget to tell you, Los Angeles Business Journal pulled a fast one on me and published its monthly home sale data in the January 7 issue. I was not expecting them to release the data so soon and did not think to check the news rack for it. Since I never got a hard copy of that issue, I won't be able to report their data. Sorry about that.

DQNews reports in this January 15 story that December 2007 Southland home sales were dismal. Sales were up 0.5% from November (whoop dee do), but down 45.3% from December 2006. Is that a nose-dive or what?

Here are the ugly numbers. We are seeing double-digit declines in sales volume and prices across all counties.

Southland          Sold     Sold     %YOY    Median $    Median $   %YOY
County             Dec-06   Dec-07   Chg     Dec-06      Dec-07     Chg
Los Angeles        8,479    4,430   -47.8%   $525,000    $470,000  -10.5%
Orange             2,985    1,731   -42.0%   $630,000    $565,000  -10.3%
Riverside          4,542    2,503   -44.9%   $432,000    $355,500  -17.8%
San Bernardino     3,357    1,518   -54.8%   $370,000    $315,000  -14.9%
San Diego          3,823    2,468   -35.4%   $495,000    $430,000  -13.1%
Ventura            1,023      590   -42.3%   $590,500    $525,000  -11.0%
SOUTHLAND         24,209   13,240   -45.3%   $490,000    $425,000  -13.3%

One DataQuick analyst observes, "It is like any anybody who can, is waiting this thing out. We won't know what really has been going on until things have settled down and we can look back." So now the analysts now claim that they can't forecast with such a "lousy basis" in the numbers. Hmm, it was easy to forecast that the market would keep going up while the numbers were going up. Is it so hard to forecast that numbers might continue to decline?

The median Southland home price has nearly reached the February 2005 price of $420,000. The $505,000 median peak was reached in the spring and summer of 2007. Jumbo loan financing is now about 22% of the Southland market, compared to almost 40% before the credit crunch.

DataQuick reports that down payment sizes are stable. Flipping rates are stable and non-owner-occupied housing activity is edging up. They interpret this as a positive sign but I see that as simply not enough people having gotten burned yet.

The DataQuick analyst may have a point about the difficulty of forecasting. I've said it here a few times that things have looked so bad in November and December that the market is probably due for a bounce, although a dead-cat one. Mortgage applications bounced big-time the first week of the new year. Beach city sales, too, seemed to recover somewhat. We'll have to wait and see how much the markets recover this spring selling season.

Sunday, January 13, 2008

2nd preview of December Redondo Beach sales; outstanding inventory; sellers nostalgic for 2006

I managed to pick up a few more sales for December in my records and reconcile them with my SUPPLY (inventory) records. Here is my second shot at a preliminary estimate for Redondo Beach for December.

STAT     JUN 2007   JUL 2007   AUG 2007   SEP 2007   OCT 2007   NOV  2007    DEC 2007   
records        62         78         51         68         44          37          29
MEDIAN   $764,500   $860,000   $850,000   $857,000   $755,000    $832,500    $775,000
AVERAGE  $830,711   $880,279   $867,925   $935,506   $770,416    $933,956    $822,393
MIN      $485,000   $359,000   $365,000   $369,900   $369,900    $379,000    $486,500  
MAX    $1,565,000 $2,299,000 $1,510,000 $2,400,000 $2,560,000  $2,500,000  $1,500,000

Here are the revised charts. I find it interesting that the PCTRED (the difference between final selling price and original asking price) shows an even greater change. The only other thing I find interesting is that those folks who are able to write checks for properties exceeding $1 million seem to have been on vacation this month. Prices seem to have sunk back down.

I tried my best to update all current asking prices in the supply records in my database and then I took another inventory snapshot. For these properties, median original asking price is $849,000, average is $997,947. Median current asking price is $825,000, and average is $959.946. So we see some divergence between unsold properties and sold properties again, which may be due to the wealthier home buyers not buying anything in December.

Here are the charts.

Square footage tends to run slightly higher on the unsold properties than on sold properties.

DOM continues to be quite bottom-heavy. In spite of my efforts to clean up some of this unresolved inventory a few months ago, the bottom heaviness persists. Median is running at 200 days, and average is 228. Average is running in excess of 7 months!

For normal markets in other slower parts of the country, it probably isn't unusual for properties to sit on the markets for longer than 6 months. For Southern Californians spoiled by years of appreciation in excess of 20% annually and lines of people to bid on hot properties, 6 months could be an eternity in hell.

This is a far cry from the DOM of 49 that was reported last month for the beach cities by Shorewood, isn't it. DOM obviously means different things to different people. I define it as "time spent hustling a property", which is something like the continuous DOM that some realtors use, but not exactly.

I would not expect the percent reductions from original asking prices to exceed that for properties that were successfully sold, and that indeed is the case. On roughly 50% of these unresolved properties, sellers have either not lowered their prices or actually increased their asking prices. The median change in asking price is 0.1%, and the average is 3.3%. The median has finally moved off of 0%, but barely. So are these sellers on a fishing expedition, or are they serious about getting their homes sold?

Speaking of serious sellers, check out this January 13 L.A. Times article by Darryl Satzman: "Current market leaves sellers nostalgic for 2006." Although I still personally believe economist Chris Thornberg is too optimistic when he says prices will stay flat between 2009 and 2011, he is one of the few economists who has been somewhat ahead of this collapse. I find it interesting that whereas in 2006 most economists said that the solid job market in California would lessen the likelihood of any real weakness in the housing market and demand would remain strong, now the folks at DataQuick are saying that job growth numbers are "volatile."

I also think it is irrelevant whether there is a recession or not as to whether the downturn will get worse. Some economists define a recession as 2 consecutive down quarters, which in my opinion is like defining a tree as having 35 branches with a circumference at the base greater than 3 inches. A diseased economy can take many forms that do not precisely fit an economist's irrelevant definition, so who cares if it's labeled a recession or not?!? Some of these economists still apparently have not yet caught on to the fact that the economy has been so dependent on the housing market and the tail has been wagging the dog.

DataQuick thinks Los Angeles County will hold up better than Riverside due to older housing stock and people being in their homes longer. There may be some merit to that argument, but I want to add two caveats here. One is that the rug has been pulled out from under the mortgage market, so even a $400,000 property might as well be $1 trillion in the eyes of some potential buyers. In spite of all the pissing and moaning in the press about the slow housing market, the fact remains that the credit bubble is still built into several years of housing prices here in Los Angeles, and that needs to be deflated. We have experienced a mild price decline, but on sales that are running somewhere between 25% and 33% of what they were just a few short years ago. There's lots of credit bubble to realize still in prices. Second, what direction will social mood take? In a population experiencing a negative mood toward the housing market, what will a riot or a timely earthquake or other calamity do to worsen people's perceptions of the housing market? During a positive mood phase, such calamities are viewed as obstacles that we can bravely overcome, but in a negative mood phase, those events become excuses to bail out and leave.

Tuesday, January 08, 2008

Preliminary look at December 2007 Redondo Beach sales

I am still scraping sale data out of the Manhattan Beach Reporter. Zillow's condition has improved slightly but still worthless for my purposes. MBR does not give exact sale dates so my estimates now fall to the first day of the reporting period.

I don't have enough records here for real statistical validity, so just keep in mind I'm doing the best I can with what I've got. The table below is my ongoing saga of estimates based on my SUPPLY (inventory) records:

STAT     JUN 2007   JUL 2007   AUG 2007   SEP 2007   OCT 2007   NOV  2007    DEC 2007   
records        62         78         51         68         44          37          26
MEDIAN   $764,500   $860,000   $850,000   $857,000   $755,000    $832,500    $782,500    
AVERAGE  $830,711   $880,279   $867,925   $935,506   $770,416    $933,956    $832,827
MIN      $485,000   $359,000   $365,000   $369,900   $369,900    $379,000    $486,500  
MAX    $1,565,000 $2,299,000 $1,510,000 $2,400,000 $2,560,000  $2,500,000  $1,500,000

I will throw in here that the median original asking price on these sold properties in December was $852,000, and the average original asking price was $905,484.

Median square footage for these sales is 1708 and the average is 1814.

What I call median DOM (time spent hustling a property - see prior posts), dropped every so slightly to just a shade under 3 months - 86 days. Average DOM is 137 days.

By how much did December homesellers have to drop their original asking prices? The median reduction was 6.24%, and the average was 7.83%. These figures have been slowly creeping up.

Sunday, January 06, 2008

Los Angeles County South Bay Beach Cities Real Estate $$$ Transacted for December 2007

December was another sick month in terms of dollar volume. The zip codes that exceeded December 2006 in terms of dollar volume were 90064 (Rancho Park), 90292 (Marina del Rey), 90094 (Playa Vista), 90232 (Culver City), and 90717 (Lomita). Of those zip codes, I'd say only that 90064 and 90094 have been on steroids - the remaining markets are more advanced in their dollar volume meltdown like everywhere else.

Dollar volume looks awful. Last week I heard a statistic tossed out on Bloomberg that for 2007 one out of four California realtors sold nothing, and it shows. It's at the point where I would say it can't get much worse, in terms of dollar volume. We're probably due for some kind of bounce, and the sales numbers coming in the first few days of January do indeed look a lot stronger. Those numbers are probably largely from post-Christmas activity. Of course, any pulse at all is a market improvement if the market's been dead. I think we'll see some zombies this spring.

YOY comparisons

Remember, the YOY numbers are not taken on the raw numbers, they are taken on the doubly smooth 3 month moving average. They lag the raw data somewhat.

Realtors fat and happy...
90094         113.3% Playa Vista
90254           9.4% Hermosa Beach

Not to shabby, considering...
90045           3.1% Westchester

Losing a grip...
90293          -0.9% Playa del Rey
90064          -6.1% Rancho Park/Cheviot Hills

Slip sliding away...
90501         -11.9% Torrance
90008         -15.1% Baldwin Hills / Leimart Park
90277       -16.9% Redondo Beach (south)
beach cities  -18.4% 4 Beach Cities combined
90266         -19.1% Manhattan Beach
90036         -21.0% Park La Brea
90291         -21.9% Venice
90277-90278   -23.2% Redondo Beach combined
90505         -24.9% Torrance
90066         -25.3% Mar Vista
90275         -27.1% Palos Verdes Estates
90278         -27.7% Redondo Beach (north)
90401-90405   -28.7% Santa Monica combined

Sliding over a cliff...
SW county     -31.3% Southwest L.A. County
90232         -35.1% Culver City
90503         -35.7% Torrance
90245         -36.1% El Segundo
90501-90505   -36.2% Torrance Combined
90034         -36.4% Palms
90019         -38.8% Country Club Park/Mid City
90230         -38.9% Culver City
90732         -39.1% San Pedro/Rancho PV
90292         -39.7% Marina del Rey
90717         -43.3% Lomita
90504         -44.5% Torrance
90035         -45.0% West Fairfax
90007         -45.5% South Central

Over the cliff, Thelma and Louise style...
90250         -53.8% Hawthorne
90056         -54.4% Ladera Heights
90304         -56.3% Lennox
90301         -59.7% Inglewood
90043         -61.6% Hyde Park, Windsor Hills
90016         -64.9% West Adams
90047         -65.5% South Central
90062         -66.8% South Central
90301-90305   -68.5% Inglewood/Lennox combined
90745         -70.3% Carson
90260         -70.6% Lawndale
90746         -70.9% Carson
90302         -71.2% Inglewood
90044         -71.3% Athens
90305         -71.5% Inglewood
90502         -71.7% Torrance
90018         -72.9% Jefferson Park
90303         -75.9% Inglewood
90249         -76.8% Gardena
90037         -79.2% South Central
90744        -318.6% Wilmington
"Relative Strength"

This is a longer-term view of the strength of dollar volume, for this month with 4.8 being the strongest (suffering the least amount of chronic pain) and -0.3 being the weakest (suffering the most chronic pain). Think of it is as the area above 0 on the YOY graph with the area below 0 of the YOY graph subtracted out.

90094        4.8 Playa Vista
90305        2.9 Inglewood
90044        1.9 Athens
90034        1.8 Palms
90746        1.6 Carson
90292        1.5 Marina del Rey
90047        1.2 South Central
90062        1.1 South Central
90301-90305  1.1 Inglewood/Lennox combined
90304        1.1 Lennox
90502        1.1 Torrance
90007        1.0 South Central
90018        1.0 Jefferson Park
90745        0.9 Carson
90303        0.9 Inglewood
90016        0.9 West Adams
90302        0.9 Inglewood
90301        0.9 Inglewood
90250        0.9 Hawthorne
90037        0.8 South Central
90732        0.8 San Pedro/Rancho PV
90293        0.8 Playa del Rey
90043        0.7 Hyde Park, Windsor Hills
90019        0.7 Country Club Park/Mid City
90501        0.7 Torrance
90008        0.6 Baldwin Hills / Leimart Park
90249        0.6 Gardena
SW county    0.6 Southwest L.A. County
90503        0.6 Torrance
90230        0.6 Culver City
90064        0.6 Rancho Park/Cheviot Hills
90260        0.5 Lawndale
90291        0.5 Venice
90254        0.5 Hermosa Beach
90045        0.5 Westchester
90036        0.5 Park La Brea
90501-90505  0.4 Torrance Combined
90278        0.4 Redondo Beach (north)
90232        0.4 Culver City
90245        0.4 El Segundo
90066        0.4 Mar Vista
90277-90278  0.3 Redondo Beach combined
90035        0.3 West Fairfax
90505        0.3 Torrance
90056        0.3 Ladera Heights
beach cities 0.3 4 Beach Cities combined
90401-90405  0.3 Santa Monica combined
90717        0.2 Lomita
90266        0.2 Manhattan Beach
90277        0.2 Redondo Beach (south)
90504        0.2 Torrance
90275        0.0 Palos Verdes Estates
90744       -0.3 Wilmington

For details on individual zip codes, visit my regional tracker, or my Google map tool of most of the same data. I cover most zip codes south of the 10 freeway and west of the 10.

Dogmation