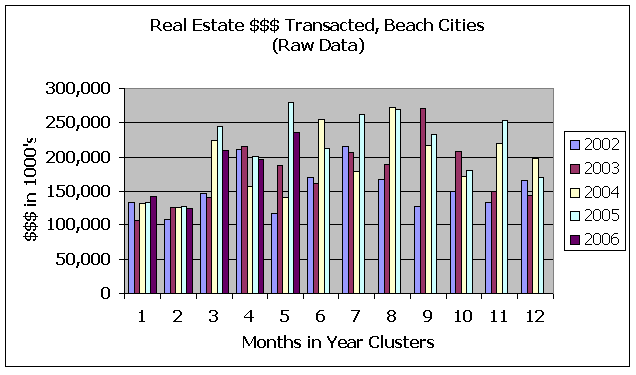
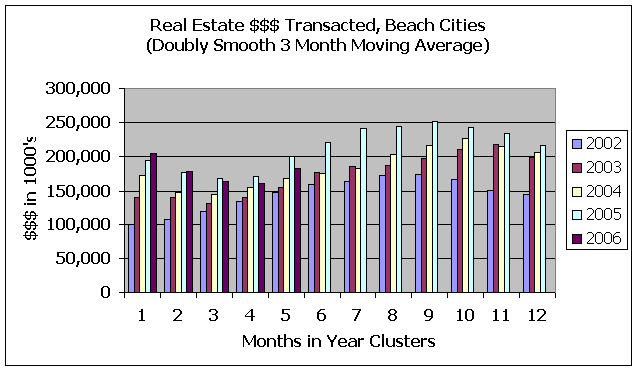
Real Estate $$$ Transacted Through May 2006 for Beach Cities
It's the affordability issue. Many areas here in and around the beach cities are in a bit of a slump, but the pin that will burst this real estate bubble has not definitively shown up. Real estate markets in areas that are good but still affordable (relatively speaking) are continuing to do well overall.
Whatever they're selling in Playa Vista (90094) has been going like hotcakes on steroids, however the YOY trend is headed down. Torrance, especially 90502, is doing well, with some zip codes making up for weakness in March and April. 90502 trend is still strongly up. Lawndale (90260) is hanging in there.
Manhattan Beach (90266) is showing a bit of a slowdown but still hanging in there. South Redondo Beach (90277) started softening in March. North Redondo (90278) had a decent April but otherwise has been soft all year.
Further north, Culver City (90230 and 90232) still seems to be hanging on, bouncing back a bit from a soft March and April. Rancho Park (90064) has been showing a steady downward slump since January.
The zip codes that are have stayed above the 0% line in the YOY graphs for most of 2006 are: 90045, 90094, 90230 (now just touching 0%), 90245 (broke back up over the 0% line but now heading back down), 90260, 90266, 90501, and 90502.
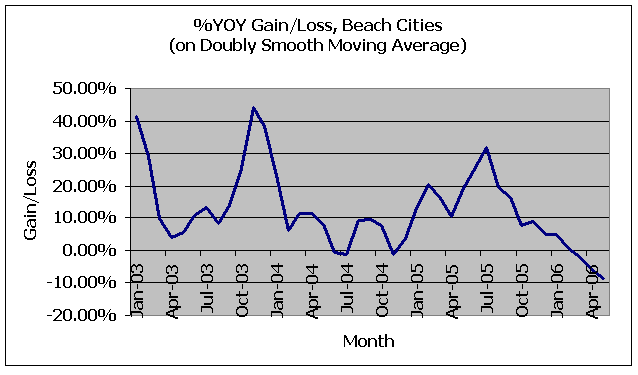
Real estate conditions are hanging in there, almost through clenched teeth. However, we do not expect this to last. If you have checked global financial markets lately, you'll know that they've been undergoing a deflationary meltdown, which in due time will probably hit here. Even some commodities have been taken out back to the woodshed and gotten smacked. The yield curve is inverting again, for the second time in less than a year. The financial clowns that run this country argue that this is a "conundrum" due to a "global savings glut" when the truth is that an inverted yield curve has been a classic predictor of a recession.
Be sure to visit the Beartopia Real Estate $$$ Tracker for an explanation of the data on these charts, and for charts for specific zip codes. You certainly won't be seeing anything like these charts in your local papers.
posted by bearmaster at 8:58 PM
![]()
![]()


0 Comments:
Post a Comment
<< Home