Wednesday, August 27, 2008

CAR/DQNews Report July 2008 Report for Redondo Beach

DQNews has released its housing market data for July 2008 for California cities. The CAR link is here.

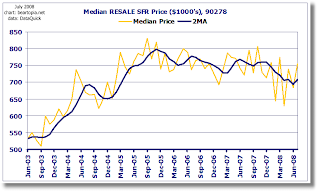
The median July sale price for a Redondo Beach home (new or existing, SFR or condo) was $752,000, down -10.5% YOY. DataQuick's statistic is based on 59 sales, which is a good number of records with which to calculate such a statistic. This calculation is better than the zip code / property type breakdown calculation which DataQuick also reports and which I complain about regularly. The former is an aggregation of new and existing home sales, SFRs and condos, in 90277 and 90278. The latter is relatively meaningless.

My preliminary calculation for July came in on the nose at $752,000, based on 49 records. That's a first!

Here is how the beach cities look.

Area               Sales      Median Price       Year Ago      Pct Change
El Segundo            6         $666,000       $1,254,500         -46.91%
Hermosa Beach        12       $1,032,500       $1,185,000         -12.87%  
Manhattan Beach      32       $1,774,727       $1,628,500          +8.98%
Redondo Beach        59         $752,000         $840,250         -10.50%    
(they don't add up)
Beach Cities         84         $972,500       $1,006,500          -3.38%

I would trust the numbers for Manhattan Beach, Redondo Beach, and Beach Cities more than for El Segundo or Hermosa Beach alone.

Beach Cities is an aggregation of South Redondo Beach, Manhattan Beach, Hermosa Beach, El Segundo, and Playa del Rey. Redondo Beach, shown in the chart above, is both the north and south parts of the city.

Los Angeles Beach Cities Resale Activity for July 2008

I am so sorry I am running so behind on my regular posts. Work is keeping me extremely busy and in my personal life I am preparing for a vacation in early October in southern Idaho and northeast Nevada to check out possibilities in future places to live.

I'll keep this short. Here are the detailed RESALE statistics for the beach cities and some of the surrounding zip codes (prices are in 1000's):

                         SFR   MEDIAN    %YOY    CONDO  MEDIAN   %YOY  
COMMUNITY         ZIP    SALES   SFR      CHG    SALES  CONDO     CHG
LA/Westchester    90045   20    $693     -5.8%     5     $337    N/A
El Segundo        90245    4    $741    -55.1%     2     $480    N/A
Hawthorne         90250   26    $496     -7.3%     4     $349   -17.9%  
Hermosa Beach     90254   10  $1,033    -17.7%     4     $898   -17.8%  
Lawndale          90260   12    $390    -15.7%     2     $305    23.0%  
Manhattan Beach   90266   27  $1,780     -3.0%     5   $1,740    77.8%  
Palos Verdes Pen. 90274   23  $1,301    -12.5%     5     $715    10.0%  
Rancho P.V.       90275   43  $1,050    -13.9%     4     $519   -15.0%   
Redondo Beach     90277    8    $850    -24.7%    10     $560   -19.9%   
Redondo Beach     90278   21    $755      4.6%    17     $759    15.7%

Friday, August 22, 2008

DQNews: Southland home sales post annual gain -- prices drop again

DQNews has published Southland home sales numbers for July. Sales are the highest in more than a year as falling Ginzu knife shoppers rushed out to scoop up "bargains." OK - not my words - but we're still in "Happy Days Are Here Again" bear market bounce mode which I expect to fizzle as the summer selling season wanes. 20,329 new and existing SFRs and condos were transacted in July, up YOY, though down -23% from the historical July average since DataQuick started tallying sales in 1988.

DataQuick acknowledges an ongoing "fire sale" of newer affordable properties. The firm says that we are not seeing such levels of distress in higher end homes, (If Mr. Mortgage's assessment is accurate, we could be seeing much higher levels of distress in higher end neighborhoods by the end of next year, as Alt-A and A level mortgage defaults kick in.)

The July Southland median home price is down -2.0% from June and down -31.1% YOY.

In June foreclosures were an upwardly revised 41.8% of all sales; in July foreclosures were 43.6% of all sales. Southland buyers committed themselves to a typical monthly payment of $1,632, down from $1,671 in June, and down from $2,447 YOY. Foreclosures remain pegged at record levels, ARM financing is at an all-time low, and non-owner occupied buying activity is flat to possibly "emerging", according to DataQuick.

County           Sales    Sales      %YOY      Median      Median      %YOY
                 July 07  July 08     Chg      July 07     July 08      Chg
Los Angeles      6,809    6,592      -3.2%     $547,500    $400,000   -26.90%
Orange           2,391    2,799      17.1%     $640,000    $461,000   -28.00%
Riverside        2,769    4,116      48.6%     $399,000    $260,000   -34.80%
San Bernardino   2,008    2,521      25.5%     $355,000    $230,000   -35.20%
San Diego        3,106    3,431      10.5%     $489,500    $364,000   -25.60%
Ventura            784      870      11.0%     $582,500    $420,000   -27.90%
SoCal           17,867   20,329      13.8%     $505,000    $348,000   -31.10%

Annette Haddad took over Los Angeles Times' DataQuick report for July. In her report dated August 19, she reports the rise in sales is driven in part by buyers attending auctions. One economist quoted in the article notes "the price mechanism is working." He issues the caveat that although higher sales are "great", there are many more foreclosures coming down the pipe and so more discounts "may be" coming.

Be sure to check out that L.A. Times article for stories of knife-shoppers, and then carefully read Mr. Mortgage's latest reports.

Tuesday, August 12, 2008

L.A. Business Journal: Home prices fall, buyers moving in

According to this story by Howard Fine in the August 11-17 edition of the L.A. Business Journal, median home prices are plummeting and the falling Ginzu knife shoppers are out in droves picking up condos in areas that have been particularly hard hit. Sales volume is approaching 2005 levels, and according to Bob Stickney, a Lancaster realtor, about 25% of buyers have no intention of living in the property, they just want to scoop up a property below $120,000 and less than 15 years old, no questions asked. OK, well the story didn't call them falling Ginzu knife shoppers - I did - but you get the idea.

At the same time, sales volume in high-end areas has fallen substantially YOY and prices are weakening too.

It's this surge in low-end activity in the hard-hit areas that is primarily driving the median price down further in July, according to the article "more than normal." A year ago the opposite situation was true - high-end sales were propping up the median price. Only now Steve Cauley at the Ziman Center for Real Estate at UCLA says this is "skewing" home prices. I don't know if he was publicly noting skewed home prices when the market was running on high-end fumes last year.

So this might be helpful to bargain hunters and first-time homebuyers, but Chris Thornberg of Beacon Economics notes that this just exacerbates the problems that some neighborhoods are having with lots of foreclosures and falling prices. In areas with middle-class homes, the market is not moving, except largely for distressed sales where "the bottom feeders are coming in" according to Thornberg.

According to Stickney, the Lancaster realtor, most of the recent buyers were renters looking to buy their first home and the rent-mortgage equation is now showing that it may be more economical to own. Stickney and other realtors were greatly surprised by the speed that buyers came out of the woodwork. That's probably likely to happen when rent = mortgage. However, I once heard a story from a wealthy man who bought a townhome in Houston after the 1980's oil bust, and he told me that people were so traumatized by the regional economic decline that they were refusing to buy even when rent was lower than mortgage. (The townhome he bought was so cheap he was able to put it on a credit card!) So for now I assume that what's happening in Antelope Valley does not mean the bottom has been reached yet.

Central Valley, the Inland Empire, and north Santa Barbara are experiencing a similar phenomenon according to Robert Kleinheinz of the California Association of Realtors.

It isn't just Joe Average out there catching falling knives. Real estate investment banks are raising funds to buy foreclosed properties. A lot of this money is coming from - urp! - pension fund advisers.

Mike Nourmand, a Beverly Hills realtor, estimates that prices in the million dollar area are off about 10% YOY. Loan underwriting standards are now far stricter, and in cases where sellers are giving "credit" for minor improvements and repairs on properties, the credits are getting factored into the selling price.

-------------------------- SFR --------------------------------
COMMUNITY          ZIP    July     %YOY        July    %YOY
                          Sales   Change      Price   Change
L.A County              4,535       -17%    $420,000  -28% 
El Segundo       90245      9       +50%    $942,000  -26%
Hermosa Beach    90254     10       -60%  $1,135,000  -19%  
Manhattan Beach  90266     20       -29%  $1,795,000   -1%  
Redondo Beach    90277     13       -19%    $820,000  -24%
Redondo Beach    90278     22         0%    $745,000   +2%

------------------------ CONDO --------------------------------
COMMUNITY          ZIP    July     %YOY     July       %YOY
                          Sales   Change    Price     Change
L.A. County              1,704      +6%    $395,000   -12%
El Segundo       90245       7     +75%    $495,000    -9%
Hermosa Beach    90254       7     133%  $1,595,000   +83%
Manhattan Beach  90266       7     400%    $999,000   +15% 
Redondo Beach    90277      15     -40%    $800,000    -1%
Redondo Beach    90278      25       0%    $665,000   -18%  

(It's amazing how 90278 sales volumes came out identical to 2007.)

The most expensive homes (SFRs) in July were in Santa Monica 90402 (-17% YOY); Malibu 90265 (+19%); Pacific Palisades 90272 (+6%); Manhattan Beach 90266 (-1%); Beverly Hills 90212 (-35%); Bel-Air 90277 (+34%); Brentwood 90049 (-9%); San Marino 91108 (+18%); Calabasas 91302 (+10%); and Palos Verdes Estates 90274 (-6%).

The most expensive condos in July were in Manhattan Beach 90266 (+83%); Mid-Wilshire 90036 (+92%); Venice 90291 (+18%); South Figueroa 90007 (YOY not available - current median now $1,003,000); Beverly Hills 90211 (-22%); Malibu 90265 (YOY not available - current median now $815,000); Pacific Palisades 90272 (+19%); Redondo Beach 90277 (-1%); Sierra Madre 91024 (YOY not available - current median now $765,000); and Hollywood Hills 90068 (+73%).

The areas suffering the greatest SFR price losses in July are Westwood 90024 (-67%); Signal Hill 90755 (-64%); Beverly Hills 90210 (-59%); Watts 90002 (-52%); Long Beach 90802 (-51%); South Los Angeles 90003 (-48%); L.A. 90011 (-47%); Panorama City 91402 (-47%); Palmdale 93591 (-47%); and Compton 90221 (-46%).

The areas suffering the greatest condo price losses are Westlake Village 91361 (-48%); Windsor Square 90020 (-42%); North Hills 91343 (-41%); North Hollywood 91601 (-39%); Newhall 91321 (-39%); Canoga Park 91304 (-37%) and 91303 (-36%); Long Beach 90815 (-37%); Hawthorne 90250 (-37%); Van Nuys 91405 (-36%).


Be sure to read the July sales report from Mr. Mortgage. Stay tuned.

Thursday, August 07, 2008

Preliminary look at July 2008 Redondo Beach housing market data

I have had a few stark reminders recently of why I don't want to own property where I currently live, in north Redondo, and why my significant other and I plan to eventually move out of Southern California.

On a very recent Saturday night we attended a potluck in downtown Manhattan Beach. It was the night that a volleyball tournament had taken place. We were running a little late, and on Manhattan Beach Blvd our car followed four police cars with lights flashing into downtown. There was obviously a lot of rowdy activity going on. From the spa where we were attending the potluck, we caught a glimpse of one drunken bozo staggering around with nothing but his underwear briefs on. Most of the other loud drunken revelers still had their clothes on. I looked at my significant other and said to him, "People pay several million dollars to live here and they put up with this kind of idiotic behavior?!?" Maybe I'm just too old or I am not the type to appreciate this magnificent beach lifestyle.

As I sit here in the study of my apartment with the window open to try to cool down this room, I can hear somebody two doors away yelling and swearing. The close proximity to our neighbors has been annoyance on many occasions and has literally kept me awake at night.

Anyway, back to the data.

My working set of data is pulled mostly out of Manhattan Beach Reporter, with a few out of Zillow. I have 49 records for July, which comes up short, so let's hope I have a good representative set of data.

Sales are continuing to mark to market all these price cuts I've been recording for so many months, which is good. It's when sales dry up that we don't know what is going on in the heads of buyers and sellers in terms of their perception of valuations. When I calculated median and average Redondo Beach sale price for July 2007 I had 78 records and I came up with median and average price of $860,000 and $880,279, respectively. For July 2008 I have $752,000 and $786,136. My July 2008 median sale price is down -12.5% YOY. I think there is a good chance we will continue to see YOY prices slide when the official numbers come out later this month from DataQuick - however, if this market is currently driven by higher end sales, we may see an increase from June.

Sale Price

STAT      JAN 2008   FEB 2008   MAR 2008   APR 2008   MAY 2008    JUN 2008   JUL 2008
records         25         25         35         40         61          50         49
MEDIAN    $795,000   $755,000   $789,000   $756,000   $742,000    $704,000   $752,000
AVERAGE   $932,117   $831,500   $961,714   $833,000   $775,589    $754,000   $786,136
MIN       $449,900   $520,000   $585,000   $420,000   $269,900    $420,000   $449,500
MAX     $2,130,000 $1,590,000 $2,100,000 $2,425,000 $1,430,000  $1,351,000 $1,725,000

Sales by Square Footage

For July 2007 I calculated the median square footage of a sold property at 1762 and the average at 1838. For July 2008 my calculations came in at 1892 and 1956, respectively. Both numbers are up substantially, lending credence to the idea that higher-end sales have been driving the market very recently.

DOM (Time on Market)

My July 2007 calculation of time on market was a median 68 days and an average 104 days. For July 2008 I come up with 138 and 204, respectively. This has edged up from my prior month calculations. The "tale of two markets" continues, with literally two axes in the graph - one for the home sellers who sold relatively quickly, and one axis for those whose properties have been sitting on the market for literally years now. I doubt the median and the average are reflective of the typical current homeseller's experience. Either the property has been sitting on the market for ages and has had its price reduced substantially, or the nervous homeseller has entered the market with a very competitive price and succeeded in getting the property sold relatively quickly.

Percent Reductions

And how much did sellers have to lower their asking prices in order to make their sales? For July 2007, I calculated a median reduction of 1.91% and an average reduction of 3.87%. For July 2008, I have calculated a median reduction of 7.41% and an average reduction of 8.75% for sold properties. There is virtually no change from June.

Asking Price History

Median asking price for properties entering the market in July (or for which I have reductions still recorded for July) seems to have taken a sharp turn up, to $799,000. Hope springs eternal. After all, this is supposed to be THE best time of year for this housing market. My feeling is these sellers will experience the same disappointment at not getting their dream asking prices as a lot of other sellers are experiencing. Be sure to read Mr. Mortgage's blog and watch his videos for an explanation of what's coming down the California pipeline.

July Short Sales

Out of 49 sale records I have recorded, I show 11 short sales, but one prior sale record is highly questionable, so let's call it 10. Ten short sales is exceeding 20% of the sales I have recorded.

If I throw out the questionable record for Anita Street, the average short sale difference I recorded is 9%.

I have not yet discovered a short sale from a prior sale in 2003.

SALE      PRIOR SALE       %      ADDRESS
DATE          DATE       RED
2008-07-28 2005-06-17  -5.0% 2317 Harriman Lane B
2008-07-23 2005-11-15  -6.0% 531 Esplanade 304
2008-07-21 2004-04-29  -2.0% 2110 Rockefeller Lane 2
2008-07-07 2007-02-21  -1.0% 1636 Goodman Avenue
2008-07-18 2005-05-13 -21.0% 2408 Phelan Lane A
2008-07-07 2008-01-28 -23.0% 419 Anita Street A
2008-07-28 2005-11-15 -10.0% 2109 Plant Avenue B
2008-07-28 2004-04-15  -1.0% 2503 Rindge Lane
2008-07-18 2005-09-27  -9.0% 1516 Ford Avenue
2008-07-14 2007-03-28  -6.0% 200 S. Catalina Avenue 101
2008-07-21 2005-08-16 -29.0% 510 The Village 307

Tuesday, August 05, 2008

Los Angeles County South Bay Beach Cities Real Estate $$$ Transacted for July 2008

I apologize for taking a little longer than usual to get the monthly dollar volume charts up, but work demands have forced me to drop a number of extracurricular activities, plus I wanted to take the time to grow these charts. They contain over six years of data, and since I want you to be able to see the bubble full-blown and the ensuing fallout from the burst, I don't want to lop off the year 2002.

Nothing has really changed. The summer bounce continues. You can check out the YOY July comparison here in this table. El Segundo (90245) had a good month relative to last year. Hermosa Beach (90254) and South Redondo (90277) had especially horrible months relative to last year. North Redondo's (90278) sales volume matched last year's, but dollar volume is down. Manhattan Beach (90266) is down from last year.

Zip      Sales    Sales    Dollar Volume    Dollar Volume
         2008     2007    2008($1000's)    2007($1000's)

90245      16       10       $11,952            $9,430          
90254      17       27       $15,861           $41,499          
90266      27       31       $45,360           $54,095
90277      28       41       $25,340           $39,278
90278      47       47       $33,041           $35,579

YOY Comparisons

These numbers are a YOY comparison of the doubly smooth moving average of dollar volumes. I think of them as "recent pain" (or recent gain) indicators.

Culver City is showing a little bit of resilience this summer. Everything else is down YOY.

90232            6.2%      Culver City
90035        -18.3%      West Fairfax
90245          -23.6%      El Segundo
90302          -29.3%      Inglewood
90292          -31.3%      Marina del Rey
90045          -32.9%      Westchester
90275          -35.0%      Palos Verdes Estates
90034          -38.7%      Palms
90505          -39.5%      Torrance
90254          -41.4%      Hermosa Beach
90401-90405    -42.1%      Santa Monica combined
90501          -43.4%      Torrance
90064          -43.7%      Rancho Park/Cheviot Hills
90291          -45.2%      Venice
90717          -45.2%      Lomita
90746          -45.9%      Carson
90066          -47.0%      Mar Vista
90008          -47.3%      Baldwin Hills / Leimart Park
90502          -47.5%      Torrance
90305          -47.6%      Inglewood
90501-90505    -47.9%      Torrance Combined
90277          -48.2%      Redondo Beach (south)
beach cities   -48.3%      4 Beach Cities combined
90277-90278    -49.1%      Redondo Beach combined
90007          -49.5%      South Central
90504          -49.7%      Torrance
90278          -49.9%      Redondo Beach (north)
SW county      -50.0%      Southwest L.A. County
90094          -50.0%      Playa Vista
90230          -51.1%      Culver City
90056          -51.1%      Ladera Heights
90249          -51.4%      Gardena
90266          -54.0%      Manhattan Beach
90019          -55.0%      Country Club Park/Mid City
90260          -55.2%      Lawndale
90745          -55.3%      Carson
90250          -55.6%      Hawthorne
90503          -56.7%      Torrance
90301-90305    -58.0%      Inglewood/Lennox combined
90247          -60.9%      Gardena
90036          -61.6%      Park La Brea
90303          -61.9%      Inglewood
90062          -62.5%      South Central
90047          -63.4%      South Central
90293          -63.7%      Playa del Rey
90732          -64.3%      San Pedro/Rancho PV
90016          -65.0%      West Adams
90731          -66.7%      San Pedro
90043          -66.9%      Hyde Park, Windsor Hills
90301          -68.1%      Inglewood
90044          -74.8%      Athens
90018          -79.6%      Jefferson Park
90037          -80.0%      South Central
90304          -81.6%      Lennox
90744         -147.5%      Wilmington

Relative Strength

This is a longer-term view of the strength of dollar volume in a given zip code. For this month 5.4 is the strongest (suffering the least amount of chronic pain) and -1.6 is the weakest (suffering the most chronic pain). Think of it is as the area above 0 on the YOY graph with the area below 0 of the YOY graph subtracted out.

90094         5.4  Playa Vista
90247         2.9  Gardena
90305         2.5  Inglewood
90034         1.6  Palms
90044         1.4  Athens
90292         1.3  Marina del Rey
90746         1.2  Carson
90047         0.7  South Central
90502         0.7  Torrance
90301-90305   0.7  Inglewood/Lennox combined
90062         0.6  South Central
90007         0.6  South Central
90302         0.6  Inglewood
90501         0.6  Torrance
90304         0.6  Lennox
90016         0.5  West Adams
90018         0.5  Jefferson Park
90293         0.5  Playa del Rey
90745         0.5  Carson
90250         0.5  Hawthorne
90301         0.5  Inglewood
90064         0.4  Rancho Park/Cheviot Hills
90254         0.4  Hermosa Beach
90732         0.4  San Pedro/Rancho PV
90303         0.4  Inglewood
90045         0.3  Westchester
90008         0.3  Baldwin Hills / Leimart Park
90019         0.3  Country Club Park/Mid City
90291         0.3  Venice
90043         0.3  Hyde Park, Windsor Hills
90037         0.3  South Central
90245         0.2  El Segundo
90230         0.2  Culver City
90232         0.2  Culver City
90249         0.2  Gardena
90503         0.2  Torrance
SW county     0.2  Southwest L.A. County
90036         0.2  Park La Brea
90501-90505   0.2  Torrance Combined
90260         0.1  Lawndale
90066         0.1  Mar Vista
90278         0.1  Redondo Beach (north)
90505         0.0  Torrance
90401-90405   0.0  Santa Monica combined
90731         0.0  San Pedro
90035         0.0  West Fairfax
90277-90278   0.0  Redondo Beach combined
beach cities  0.0  4 Beach Cities combined
90056        -0.1  Ladera Heights
90717        -0.1  Lomita
90277        -0.1  Redondo Beach (south)
90266        -0.1  Manhattan Beach
90504        -0.1  Torrance
90275        -0.2  Palos Verdes Estates
90744        -1.6  Wilmington

Just for fun, look at the July 2007 numbers and it'll be obvious that these numbers have been sagging for the past year.

View individual zip codes in the regional tracker here.

Dogmation