March showed some weakness in the South Bay in total real estate $$$ transacted. This number is taken by multiplying the number of sales for each month by the average sales price for that month. Because the data is so choppy, I take a doubly smooth moving average to "spread the wealth", so to speak. The very early data for 2002 contains a slight correction from the last time I posted these charts.
Anecdotally, I can tell you in the 11 years we've rented on this north Redondo street, this is the first year that realtors have left calendars, business cards, and brochures on our doorstep. Twice. If real estate $$$ are down, realtors are likely to feel the decline even before the homesellers, who, if they've held the property for several years, can still sell at an excellent profit. The realtor, though, must make a living off of commissions, which decrease as transaction $$$ shrink. So I think the realtor visits indicate that they are looking for buyers.
Manhattan Beach in particular showed continuing strength, in spite of reports of a big jump in average days on market. However, April is off to a blazing start in just about all the Beach Cities - home sales have surged (not yet shown in this data). If this holds up throughout April, real estate activity, measured in $$$, will exceed last April's activity. Will this new spring momentum develop legs? Although there seems to be quite a bit of building activity, this area is not plagued by the excess of new inventory in places like Arizona and Florida where they just haven't stopped building! There are no announcements of major job losses in the area. So maybe that new momentum will develop some legs - then again, maybe not. In the meantime, do not be surprised to see talk in the local beach papers about how the market has recovered. Now, back to March:

For March, 90245 (El Segundo) is barely over last's years activity. El Segundo is somewhat problematic, as it is such a small town that any construction project is bound to make the data extremely lopsided.
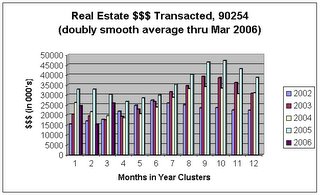
Both the raw and the doubly smoothed moving average of 90254 (Hermosa Beach) continue to show a deterioration in real estate activity.
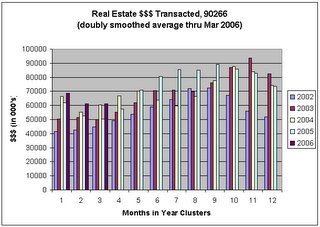
90266 (Manhattan Beach) continues to show strength, as mentioned. By the way, this city has become a two-class town. Currently there is a furious debate raging over the undergrounding issue. When first proposed a number of years ago, the estimate of the assessment per home was fairly low - I heard it was as low as $8000. Now it is $40,000. Senior citizens who have lived in their homes for 30, 40, even 50 years are screaming bloody murder. The city is trying to strong-arm them into borrowing against the equity in their homes in order to pay for the undergrounding, and they (very sensibly) don't want to borrow money. This is the poor side of town. The wealthy side of town is comprised (in part) of young rich sports stars in multi-million dollar mansions, who can easily plunk down $40K for undergrounding. It's a sad state of affairs when city politicians can pressure you into going into debt. A sign of these bubble times.
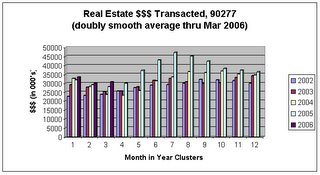
90277 (south Redondo Beach) also continues to show some strength, though the raw data shows the first YOY dip since October.
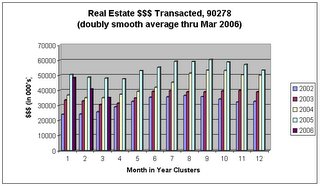
90278 (north Redondo Beach) still remains the weakest zip code, with the third consecutive month of declines both in the raw and the doubly smoothed moving average.
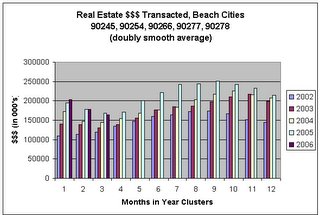
We have combined real estate $$$ transacted for 90245, 90254, 90266, 90277, and 90278 into one Beach Cities chart that shows an ever-so-slight YOY loss of momentum in January, a slight flattening in February, and a small dip in March.
What is the one thing that you notice practically leaping out of these charts? Notice how the sky blue bars tend to form an arc pattern somewhere in the second half of 2005? For 90254, the arc peaks in early autumn; for 90277, the arc peaks in the summer months; in 90278, the arc is notably flatter; 90245 actually had a better year in 2004 so the 2005 arc is not as meaningful. What we'll be looking for later this year is how far we fall short of that arc (or IF we fall short of that arc). That arc looks like a market peak.
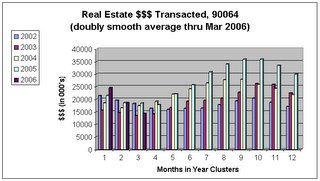
We are featuring a "guest" zip code, 90064 (a part of west LA), that shows YOY weakness for the first time since April 2005.


