Graph of Southland Home Prices Since 1989
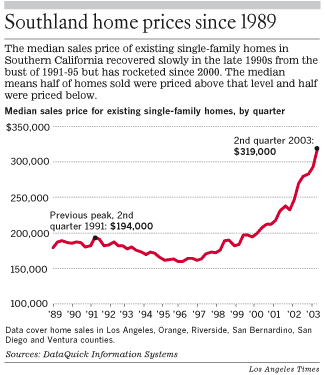
This is an LA Times graphic of the median sales price of a home in the southland since 1989. Unfortunately the graph only goes through 2003. The median price has since climbed to about $500K, which would put the red line - oh, about at the thick light gray bar at the top, above the words "Southland home prices since 1989".
Such a line looks a lot like Nasdaq in 2000, doesn't it.
You can view the original LA Times graphic here.
posted by bearmaster at 7:38 AM
![]()
![]()


0 Comments:
Post a Comment
<< Home