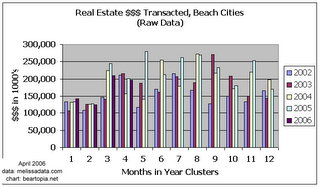
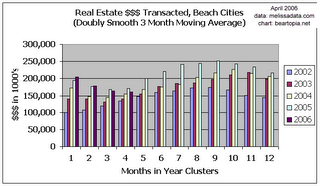
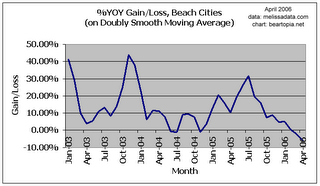
Real Estate $$$ Transacted through April 2006 for Beach Cities
Be sure to follow up by visiting the tracker link at the end of this post!
Realtors must be breathing a sigh of relief. The business that looked like it was slipping away during Q1 has bounced a little, even if only temporarily. One third of 2006 is now past us, and overall, the south bay beach cities are still a bubble that have not yet encountered the pin that is popping other areas. Other parts of the nation and even other parts of California are busy popping their bubbles, and we've barely gotten started. This area is not showing glaringly obvious price declines yet, but the pin will sooner or later show up here. Overall, there is an ever-so-slight slump in the market, but nothing crumbling or falling apart at the seams. By "slump" we mean - a loss of price gain momentum, not necessarily visible price declines.
El Segundo (90245) is waaaaay too up-and-down to name a trend either way.
Manhattan Beach (90266) and South Redondo (90277) are (finally!) taking a breather. We will know later this year whether it only temporary.
Hermosa (90254) has rebounded so far that total $$$ transacted for April exceeds April 2005 by 105%. North Redondo (90278) has rebounded for April and exceeds April 2005 by about 40%.
What about some of the surrounding areas? If anything, a few of these areas are possibly benefitting from the affordability issue in the beach cities. However, most areas are showing signs of a similar slump.
Overall, Torrance is doing OK. 90501 (around the old downtown) has had a respectable four months, but 90502 (the Torrance Harbor-UCLA medical center area) has been taking flight as if the real estate frenzy has relocated there. 90503 had a weak Q1 but rebounded a bit in April. 90504 (north Torrance) seems to be in a mild slump this year, and 90505 (west/southwest) seems to be having a rocky year.
How about north?
90094, Playa Vista, is not even analyzable, as it has been undergoing such incredible explosive growth. The charts show that - although the frenzy has cooled off a bit. Playa Vista makes the gains of the beach cities in recent years look almost sickly by comparison. 90293, Playa del Rey, on the other hand, has had that telltale Q1 slump and did not even rebound in April. Playa Vista is probably sucking away any buyers. 90292, Marina del Rey prices are still moving like a freight train, oblivious to any early bubble popping in the surrounding areas.
The momentum in Culver City (90230 and 90232) is headed downwards. 90066, Mar Vista, like Playa Vista, has been in a Q1 slump that it didn't bounce out of in April. 90035, Palms, had a weird spike in July 2003 that makes the data difficult to put on a chart, but overall, it, too, has been in a slump this year. 90291, Venice, looked like it was hanging on early this year but has recently fallen into a slump. 90064, Rancho Park, too, is feeling a newish slump. Rancho Park's price momentum is the lowest it's been in over three years.
So what can we conclude? Looking at one zip code, e.g., 90278, it would be easy to conclude that it has shaken itself out of the doldrums, but a look at the comprehensive beach cities data plus the data from surrounding areas shows that the slump is not just a single zip code issue - it is showing up in many places. The bubble remains intact, but could be starting to deflate. We will see if the April bounce has legs. In the meantime we will continue to watch, wait, and seek out additional sources of (free and easily accessible) data that will help us monitor a trend change.


Be sure to visit our south bay housing tracker for the details on these charts and for specifics on any particular zip code.


4 Comments:
Hey, thanks for the followup! Those are the kind of numbers I guess we'll be expecting to see a stronger downtrend like that a year from now.
Please continue to keep us posted.
Hi red_flannel,
No, I certainly don't mind the question but we'd probably have to ask some real estate pros for the correct answers. Are you talking about the numbers in the monthly LA Times page (SoCal Resale link on the sidebar here)?
My guess is that Melissa Data gets the information in more haphazard chunks so it is not as "complete", whereas DataQuick's analysis is done later, when all the data is in. Sort of like a "preliminary" then a "final". Also, that LA Times page deals only with existing home sales, not new sales. I think Melissa Data covers both new and used homes.
The reporting certainly is not consistent, it's almost they want to keep us in the dark.
I've actually considered using DataQuick's LA Times numbers for my charts but they report medians, not averages.
This link was in the original post. You can find all the zip codes I did there, not just the beach cities:
Beartopia Housing Tracker
The beach cities are 90245, 90277, 90278, 90266, and 90254, as reported in the local papers.
For moving averages, calculations start from late 2001.
If Melissa Data does all home sales and DataQuick does only existing home sales, I might expect the Data Quick numbers to look a little worse.
I am not sure how one would use the DataQuick data and compare it to Melissa Data, though, since Melissa Data is for all types of homes as far as I know, and DataQuick pulls out the SFRs and condos separately. I would expect condos to look far worse than SFRs.
Average is a fantasy figure. Median is a little more realistic. In the example I gave in the original post of four houses selling for $100K, $100K, $100K, and $500K, the average would be $200K but the median is $100K, which is a somewhat more realistic number of where the market activity is.
Post a Comment
<< Home