DQNews South Bay Resale Activity for June 2006
According to DQ News, the June Monthly resale activity for the south bay area showed the following:
Zip     # SFR   Median   %Chg   # Condo  Median    %Chg
        Sales   $SFR      YOY    Sales   $Condo     YOY
90045    40     800,000   7.4      4     367,000    9.9
90245    11     880,000  -3.6      3     649,000   32.4
90254    11   1,050,000 -24.7      5   1,345,000   87.1
90260    17     561,000  12.2      7     310,000    0.0
90266    50   1,585,000   0.3      8   1,045,000   -0.2
90277     7   1,169,000  12.5     33     675,000   -8.6
90278    29     799,000   5.6     25     760,000   17.9
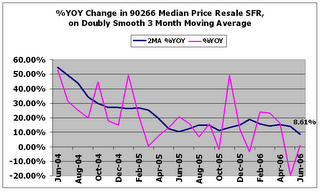
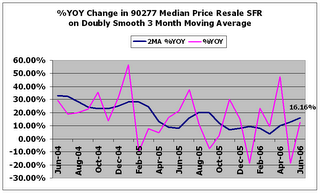
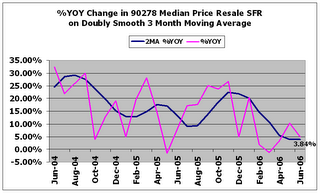
The charts below look at resale activity just for SFRs. The dark blue trend line in a chart is the YOY change in a doubly smooth 3 month moving average of the median SFR price in that zip code. The pink line is the raw %YOY change without smoothing it. I like to take moving averages because seasonal activity does not always precisely "match up" (e.g., sometimes Easter sales fall more in March, sometimes more in April).
The results are mixed. Overall, price momentum has slowed this year, indicated by a downward drift, subject to some rebounces. A trend toward an overall longer term price decline in median prices is not here yet. We can see by the pink lines, that there have been some dips below 0%, but they have tended to rebound.
Since these are sales of existing SFRs, I don't think the resiliency of prices here can be blamed on an upward bias caused by new, bigger, bubblier construction. The bubble is hanging in there, at least through June 2006. Things will start to get far more interesting when we start seeing the trend consistently at or below 0%.
Note: The earliest data will have a slight inaccuracy, since I don't have available the data prior to June 2003 to accurately calculate moving averages.


0 Comments:
Post a Comment
<< Home