For data junkies - other measures of beach cities market activity
I went through the reports at Shorewood Realtors, pulled out the following data, and charted it. The numbers are not flawless - there were a few slight inconsistencies in the reporting and a data hole in January 2005 that I had to guesstimate over. Nevertheless, I think we can spot the trends here.
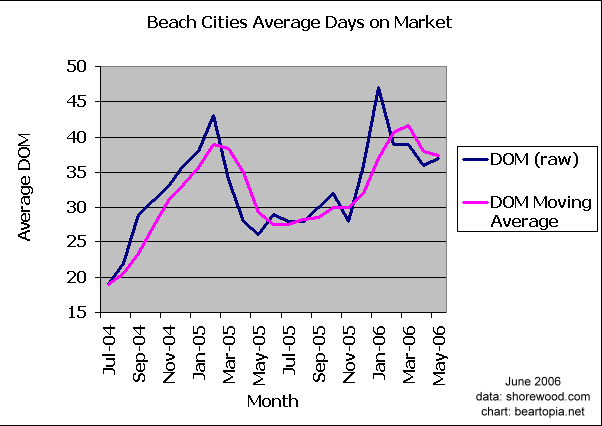
Average days on market is an abused number if ever there was one. It can be grossly understated, if home sellers in a weakening market pull their properties off the market then try relisting at a lower price. Even so, the DOM trend is worming its way upwards.

"Supply strength" is a measure that I tinkered out. You could say it's a politically correct way to say "demand weakness". I wanted to show inventory in relation to the sales activity absorbing the inventory, not just raw inventory numbers. Rising inventory by itself does not indicate a weakening market, as long as there are sales to absorb it. Notice in the chart how the lines kiss 0 around May-July 2005, probably the market peak. Ever since, the lines have been trending upwards, indicating weaker sales activity.
posted by bearmaster at 8:15 AM
![]()
![]()


0 Comments:
Post a Comment
<< Home