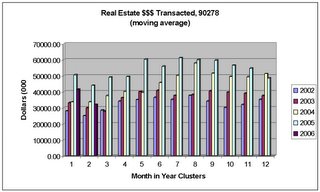
Real Estate $$$ Transacted, 90278, through February 2006

The image above uses numbers taken from Melissa Data (links in the Links section of this page). I took sales data for 90278 from 2002 and for each month multiplied the number of sales by the average sold home price. The resulting data is dollars transacted in thousands of dollars. The results were a bit choppy because sometimes certain months had a huge lump of sales. So I applied a moving average to the monthly data and came up with a smoother graph.
Months 1 and 2 (January and February) show data for 2002-2006; the remaining months show data for 2002-2005. As you can see, for just about any given month, the real estate dollars transacted has climbed steadily YOY. There is a barely noticable dent in May 2004, but the first real sign that dollars transacted has declined is December 2005. Thereafter, January 2006 shows a very clear dip in dollars transacted, and February 2006 was not only lower than 2005 but even 2004. (The original data, without the moving average, also confirms this.)
The slump is here.
P.S. Sorry I've been quiet lately - I had to get my taxes ready for the accountant and I am preparing for a trip to Colorado.


0 Comments:
Post a Comment
<< Home