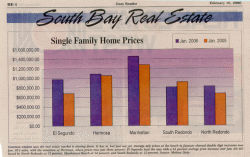
Single Family Home Prices 2005, YOY
 The print version of the Easy Reader published this chart in the February 16, 2006 edition. Click through and you will see a larger image.
In case it is unreadable, the text says,
"Common wisdom says the real estate market is slowing down. It has to, but not just yet. Average sale prices at the beach in January showed double digit increases over Jan. 05's sales, with the exception of Hermosa, where prices have risen just three percent. El Segundo lead the way with a 43 percent average price increase over Jan. 05; followed by North Redondo at 23 percent; Manhattan Beach at 14 percent; and South Redondo at 12 percent. Source: Melissa Data."
The graph does not seem to match the text though. For example, the graph shows South Redondo down but the text says South Redondo is up 12%. Given that prices here have been unsinkable, at least up to now, we think the text is probably correct, and the graph is erroneous.


4 Comments:
Everyone expected this underhanded move. The change from reporting the median price to the average price is all you need to know. FI:
MANHATTAN BEACH
Jan '06: $1,490,000 1.71%
Jan '05: $1,465,000
Not the 12% they report or:
EL SEGUNDO
Jan '06: $751,250 9.67%
Jan '05: $685,000
Not quite 43% either.
Try: http://www.dqnews.com/ZIPCAR.shtm
Damn, a few weeks ago they were publishing a multi-decade chart of rising home prices in the area. I should have clipped it out. It's almost as if the recent news is not bubbly enough to publish so they want to show how if you hold over the "long term" you've got nothing to worry about.
I'll put a link to the DQ News monthly home sale data for LA County on my sidebar.
From a friendly lurker, whom I am trying to talk into registering:
Hi--
Couldn't handle the hassle of getting a blogger name just to tell you something brief. Is there an easier way to make comments? I'm a
long-time lurker on Ben's housing bubble blog.
Anyway---today's L.A. Times real estate section has some interesting y-o-y numbers.
El Segundo (SFR)--$773,000 median--up 12% (10 houses sold in January)
Manhattan Beach (SFR)--$1,480,000 median--DOWN 3.3% (21 houses sold in
January)
Hermosa Beach (SFR)-- $1,100,000 median--up 10% (7 houses sold in January)
Redondo 90277 (SFR)--$988,000 median--DOWN 18.6% (14 houses sold in January)
Redondo 90278 (SFR)--$786,000 median--up 20.6% (9 houses sold in January)
I'm most interested in El Segundo, Hermosa, and parts of Torrance myself, but I thought this info. might be interesting for your blog.
Sincerely,
An occasional reader :)
---------------
Great info, though I will point out that the Melissa Data is more inclusive in terms of tallying home sales (SFR+condos+townhouses) so the data differs.
Also I'll point out that the YOY number of sales data on Melissa has not conclusively indicated a trend in either direction. For example, the December YOY sales for 90278, starting from December 2002, are: 78, 67, 74, 45. From January 2003, are: 51, 38, 57, 31. Two years ago in January it looked like a downturn was starting - not so. The numbers are probably too small to have any real significance.
As Robert Cote pointed out, it seems they have switched from reporting median to average price, which is a great deception. All it takes is a few megabubble sales among several lower-end depressed sales to boost up the mean.
This is fascinating stuff. One could make a career out of just exposing the lies and deception perpetrated with statistics. A statistician good at playing the deception game sticks his feet in a bucket of ice water and his head in a hot oven and says, "On the average, I feel great!"
My bad. I should have mentioned the LATimes table in this morning's (Sun Feb 26 '06) paper. Yes, you are correct, the LATimes reports combined sales SFRs and Condos and their combined median. I've not worried much over the mix in the past because I always understood that the content shift on the way up would reflect the reverse. The consequence is that at inflection points top and bottom there will be lots of froth. That means highly variable numbers. Expect a few months of "inconclusive." Big deal, these aren't any more reliable numbers finer than quarterly.
Post a Comment
<< Home