Data sham continues, February 2006

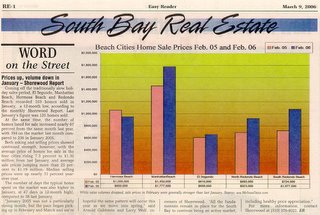
Unfortunately, the Easy Reader does not publish this chart online, otherwise I would link to it.
The chart uses the exact same numbers from Melissa Data that I used for February 2006 stats, publishing average home prices YOY. The difference is that I multiplied the average sale price by the number of homes sold to get a sense of total real estate activity in $$$ for the month.


0 Comments:
Post a Comment
<< Home