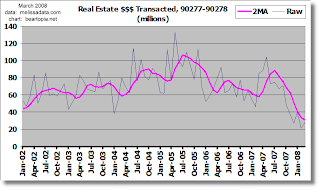
Los Angeles County South Bay Beach Cities Real Estate $$$ Transacted for March 2008
Believe it or not, the housing market is registering a pulse. I think housing sales are finally starting to pick up a bit, but in light of what has happened to the mortgage markets in recent months, I have no way to estimate how far a bounce will go. My client that works in mortgage at Wells Fargo is still busy and I fully take her word for it.
The FHA flyer that landed on my apartment doorstep the other day scared me. I call that FHA loan program "subprime + 5%", because for Redondo Beach prices they will probably want 5% down, but with few questions asked, such as, "Where is the money coming from?!?" If falling knife shoppers come flooding into this market, then we'll see more of the same problems a few years down the road when the FHA loans cave in. But then again, we'll see more problems even without these subprime + 5% loans, courtesy of our government and your tax dollars, so I'm really flying blind here. It's the market of the damned.
I find it somewhat ironic that at this point we really NEED a bounce, to get some of this unsold inventory with its history of price cuts finally sold off and marked to market. At least more sales will give us a better idea of where price levels really are, instead of leaving us just guessing.
For the most part, I'm seeing deep and frequent price cuts in unsold inventory, but a few sellers are still raising asking prices, anticipating a resurgence of the brisk housing market during the glory days of 2004-2006.
You can view a particular zip code through my regional tracker, and also my Google map tool.


YOY Comparisons
These numbers are a YOY comparison of the doubly smooth moving average of dollar volume charts. I think of them as "recent pain" (or recent gain) indicators.
Property sales and their realtors still on steroids...
90094           177.4% Playa Vista

Doing OK
90064             2.0% Rancho Park/Cheviot Hills
90501             1.7% Torrance

"I fell down down down in a burning ring of fire..."
90245            -7.3% El Segundo
90254           -12.4% Hermosa Beach
90293           -13.5% Playa del Rey
90045           -17.6% Westchester
90291           -17.8% Venice
90505           -22.1% Torrance
90034           -24.1% Palms
90292           -25.5% Marina del Rey
90401-90405     -27.2% Santa Monica combined
90056           -30.8% Ladera Heights
90504           -32.8% Torrance
90275           -35.5% Palos Verdes Estates
90501-90505     -35.9% Torrance Combined
90036           -36.7% Park La Brea
beach cities    -37.4% 4 Beach Cities combined
90066           -38.7% Mar Vista
90277           -41.2% Redondo Beach (south)
90266           -41.7% Manhattan Beach
SW county       -43.1% Southwest L.A. County
90717           -44.2% Lomita
90232           -45.3% Culver City
90732           -45.3% San Pedro/Rancho PV
90277-90278     -46.6% Redondo Beach combined
90016           -49.0% West Adams
90008           -49.0% Baldwin Hills / Leimart Park
90278           -50.3% Redondo Beach (north)
90035           -50.6% West Fairfax
90301           -52.8% Inglewood
90746           -55.3% Carson
90230           -56.0% Culver City
90019           -56.3% Country Club Park/Mid City
90007           -56.7% South Central
90043           -57.4% Hyde Park, Windsor Hills
90503           -61.5% Torrance
90250           -61.6% Hawthorne
90260           -61.6% Lawndale
90249           -62.5% Gardena
90247           -62.6% Gardena
90018           -62.7% Jefferson Park
90302           -63.7% Inglewood
90502           -63.7% Torrance
90062           -66.4% South Central
90745           -67.2% Carson
90044           -67.5% Athens
90047           -67.6% South Central
90731           -70.0% San Pedro
90301-90305     -70.9% Inglewood/Lennox combined
90304           -73.0% Lennox
90037           -76.0% South Central
90305           -82.4% Inglewood
90303           -82.9% Inglewood
90744          -142.3% Wilmington
Relative Strength
This is a longer-term view of the strength of dollar volume in a given zip code. For this month 5.3 is the strongest (suffering the least amount of chronic pain) and -1.0 being the weakest (suffering the most chronic pain). Think of it is as the area above 0 on the YOY graph with the area below 0 of the YOY graph subtracted out.
90094        5.3 Playa Vista
90247        3.1 Gardena
90305        2.7 Inglewood
90034        1.7 Palms
90044        1.7 Athens
90746        1.4 Carson
90292        1.4 Marina del Rey
90047        1.0 South Central
90062        0.9 South Central
90301-90305  0.9 Inglewood/Lennox combined
90304        0.9 Lennox
90007        0.9 South Central
90502        0.9 Torrance
90018        0.8 Jefferson Park
90016        0.7 West Adams
90301        0.7 Inglewood
90293        0.7 Playa del Rey
90745        0.7 Carson
90250        0.7 Hawthorne
90302        0.7 Inglewood
90501        0.7 Torrance
90303        0.7 Inglewood
90732        0.6 San Pedro/Rancho PV
90064        0.6 Rancho Park/Cheviot Hills
90043        0.6 Hyde Park, Windsor Hills
90037        0.5 South Central
90019        0.5 Country Club Park/Mid City
90008        0.5 Baldwin Hills / Leimart Park
90254        0.5 Hermosa Beach
90291        0.5 Venice
90045        0.4 Westchester
90230        0.4 Culver City
90503        0.4 Torrance
90249        0.4 Gardena
90036        0.4 Park La Brea
SW county    0.4 Southwest L.A. County
90260        0.3 Lawndale
90245        0.3 El Segundo
90501-90505  0.3 Torrance Combined
90232        0.3 Culver City
90278        0.3 Redondo Beach (north)
90066        0.3 Mar Vista
90731        0.3 San Pedro
90401-90405  0.2 Santa Monica combined
90505        0.2 Torrance
90277-90278  0.2 Redondo Beach combined
beach cities 0.2 4 Beach Cities combined
90056        0.1 Ladera Heights
90266        0.1 Manhattan Beach
90035        0.1 West Fairfax
90717        0.1 Lomita
90277        0.1 Redondo Beach (south)
90504        0.0 Torrance
90275       -0.1 Palos Verdes Estates
90744       -1.0 Wilmington


2 Comments:
Question...Doesn't FHA have stricter financing guidelines than other non government programs? Meaning, a maximum of 35% of buyer’s gross income can go towards monthly mortgage payments? So, I would say that most people cannot afford a home in the South Bay.
Nope! Not according to my previous post on the subject. The flyer I got the other day titled "FHA as an Option" clearly states "No income limit", "No FICO score requirement." That's why I call it "subprime + 5%", because they want as much as 5% down because of Redondo Beach prices but they are not asking too many questions about where the money comes from.
FHA is "insuring" the lenders by collecting premiums from the buyers, I don't see how the premiums will offset the potential losses.
I am not joking.
Post a Comment
<< Home