Tuesday, April 29, 2008

Other measures of Los Angeles beach cities market activity, March 2008

Shorewood has published March statistics.

According to Shorewood, March average DOM for sales in the four beach cities was 62, which I note is the highest DOM for March since I've started keeping track of Shorewood's DOM numbers back to July 2004. Take a good look at this DOM chart, because it's showing an unusual pattern here that shows DOM climbing instead of falling at this time of year. Hello! This is like a train running off its rails.

By the way, my calculation of a more realistic average DOM for Redondo Beach for March came in at 151 days.

Now let's look at Supply Strength (Demand Weakness). The most recent new high was January, but it's come down a little off that and it is still very high. In terms of inventory relative to sales, this market reached its apex in the late spring of 2005 and it's been deteriorating from there.

If inventory keeps piling on, this will stay pegged relatively high. If sellers give up and wait for the market to recover before trying to sell again, I expect this to come down. I would not expect it to sink lower than, say, 2.5. But we know darn well that this shows only the official inventory, it does not show that overhanging psychological inventory of the sellers I mentioned that want to sell but gave up. If it sinks to 2.5 without a commensurate big surge in sales, then we'll know sellers are pulling their homes off the market.

For the record, beach cities sales for March were 82, down from 222 in March 2007. Inventory was 641, up from 493 in March 2007.

And finally, median sale price for the beach cities for March was $970,000, up +4.3% YOY. The jump in median doesn't show us that NOTHING sold for less $500,000 in March, whereas 7 properties were sold in that range a year ago. Although sales are down substantially in all price categories, from looking at Shorewood's numbers, it looks like there is more inventory in the lower price ranges relative to a year ago than inventory in the higher price ranges relative to a year ago. It's the same old story - the affluent buyers who might be able to write a check for the new house are what are keeping this market afloat. There has been a shift in composition as well as a significant decline in sales volume, and we aren't comparing apples to apples here.

So what does Shorewood say about what looks to me like evidence of a market that has deteriorated and hasn't recovered its strength?

The rise in median price "Further demonstrates the beach area’s continued desirability as well as its relative immunity from forces buffeting other markets."

Let's file that sentiment carefully away and revisit it periodically.

Standard & Poors: Los Angeles area median housing price down -19.4% for February 2008

The Case-Shiller Index was released for February 2008.

According to the index, the Los Angeles area median home price was down -19.4% from February 2007, and down -4.3% from January 2008.

To view the full report, visit Standard and Poors (PDF file). S&P's home price website is here.

Sunday, April 27, 2008

Redondo Beach Snapshots

Asking prices on unresolved inventory at various times since the start of 2008. Median and current asking prices are drifting slightly downward. Notice that in the February 14 snapshot median PCTRED hit 1.0% for the first time. That was a good leap from the prior snapshot of January 10, when it was just 0.1%.

Looking at Medians       Jan 10    Feb 14      Mar 2    Mar 21      Apr 27

Original asking price  $849,000  $849,000   $842,500  $839,000    $839,000  
Current asking price   $825,000  $819,000   $809,000  $802,500    $799,000  
Percent reduction          0.1%      1.0%       1.2%      1.2%        1.3%
Square feet                1846      1833       1823      1829        1828
Days on market              200       216  no record       228         235

Looking at Averages     Jan 10      Feb 14        Mar 2      Mar 21     Apr 27    

Original asking price  $997,947   $979,651     $979,561    $975,633   $969,002 
Current asking price   $959,486   $940,822     $939,171    $933,288   $925,644
Percent reduction          3.3%       3.4%         3.6%        3.8%       3.9% 
Square feet                1923       1902         1894        1902       1893
Days on market              228        240    no record         251        257

Saturday, April 26, 2008

CAR/DQNews March 2008 Report for Redondo Beach

CAR and DQNews have released the March 2008 report for California cities.

The median sale price for a Redondo Beach home (new or existing, SFR or condo) came in $774,000 barely changed -0.77% YOY. For March, that is based on 50 sales, which is a good number of records on which to calculate a statistic. Actually, this calculation is better than the zip code / property type breakdown calculation which DataQuick also reports, about mid-month. The former is an aggregation of new and existing home sales, SFRs and condos, in 90277 and 90278. The latter is relatively meaningless.

My preliminary calculation came in at $789,000, based on 35 records. I came in slightly higher.

Prices still seem to be within the 2004-2005 range. Sales have picked up a bit at the time I'm writing this (in April). I have no particular reason to believe that prices will shoot out of that 2004-2005 range, not with the steady stream of reductions I've been busy bookkeeping in asking prices. Redondo is fighting hard to keep its head above that 2004-2005 water line.

Here's how the beach cities look:

Area               Sales      Median Price       Year Ago      Pct Change
El Segundo            9         $799,000         $845,000          -5.44%
Hermosa Beach        15       $1,150,000       $1,112,000          +3.42%   
Manhattan Beach      25       $1,425,000       $1,620,000         -12.04%
Redondo Beach        50         $774,000         $780,000          -0.77%     
(they don't add up)
Beach Cities         76       $1,112,500       $1,037,500          +7.23%

Beach Cities comprises South Redondo Beach, Manhattan Beach, Hermosa Beach, El Segundo, and Playa del Rey.

For the South Bay area, DataQuick reports a median price of $599,500, down -8.47% YOY, based on 330 sales.

The median home price in the Westside is $1,025,000, up +22.02% YOY, based on 33 sales. West Los Angeles median price was $665,000, down -14.30% YOY, based on 116 sales. Palos Verdes Estates recorded a median of $1,775,000, up +16.09% YOY, based on 15 sales, and Palos Verdes Peninsula area recorded a median price of $1,225,000, down -1.01%, based on 37 sales. Malibu is down -20.57% at $2,009,545, based on 6 sales, while Beverly Hills is up +13.11% to $1,725,000, based on 17 sales.

Overall, sales volume increased slightly over February, with *true* valuations still unknown on such low volume.

Saturday, April 19, 2008

Los Angeles Beach Cities Resale Activity for March 2008

Peter Y. Hong continues to report on the county housing situation in the Los Angeles Times April 16 story, "Foreclosure glut further depresses housing prices." He says,

The traditional spring home-buying season is off to its worst start in 20 years.

The one silver lining is that Southern California prices are now plunging at "at an astonishing rate", according to Edward Leamer at UCLA. He's of the camp that the sooner we can get this over with, the better.

Although March sales in the Southland indeed were up over February, it was an anemic +18.8%, and the Feb-Mar change in sales volume typically runs on the average of 38% higher. DataQuick notes that "a lot of people who could be buying or selling right now are opting to sit tight until they sense we've hit bottom."

Realtors are complaining that home sellers are still clinging to fantasy selling prices. David Emerson, a Lakewood broker, says that his work now largely is telling people what they don't want to hear. He notes that the shift in his career is comparable from delivering babies all day long to being an oncologist - "just giving people bad news all day long." He believes there will be much more pain ahead, with "too many foreclosures down the pike."

But Emerson, and Natalie Neith, a Beverly Hills agent, both note that homes priced very realistically sell quickly. Neith convinces sellers to lower their prices because of the tidal wave of foreclosures that are the competition.

Christopher Thornburg of Beacon Economics weighed in and said the housing downturn has gone against historical norms, occurring while the economy remained reasonably healthy - but "that's about to change. With unemployment rising and income growth slowing, we've got the typical drivers of a real estate slump again."

Builders are feeling mighty gloomy these days and don't see any sort of turnaround in new home sales this spring.

Esmael Adibi at Chapman University is forecasting further double-digit declines, noting that the typical Los Angeles County family has to spend 48.6% of its annual income on mortgage payments and property taxes to afford a median priced home. The mean expenditure for a Los Angeles County home has been 35.7% of income. To return to that level of affordability, prices will have to fall at least another 20%. Adibi notes that the gap isn't as severe in Orange County, and the Inland Empire, which has been racing ahead with its declines, is closer to a bottom.


Here are the March charts. Long-time readers know that with the exception of the charts for all of Los Angeles County, I place little value in the rest of the charts below, due to the low sales volume that generates them. It gives us one snapshot of a handful of existing home sales, that's all, and they say nothing about the backlog of inventory.

Here are the detailed RESALE statistics for the beach cities and some of the surrounding zip codes (prices are in 1000's):

                         SFR   MEDIAN    %YOY    CONDO  MEDIAN   %YOY  
COMMUNITY         ZIP    SALES   SFR      CHG    SALES  CONDO     CHG
LA/Westchester    90045   16    $780     +2.3%     3     $289   -25.9% 
El Segundo        90245    6  $1,090    +26.9%     3     $480   -25.1%
Hawthorne         90250   16    $402    -25.7%   N/A      N/A      N/A  
Hermosa Beach     90254   14  $1,100     -4.1%     1   $1,150   +23.1%  
Lawndale          90260    6    $425    -20.2%     3     $440   +33.3%  
Manhattan Beach   90266   22  $1,375    -15.1%     1   $1,320   +41.9%  
Palos Verdes Pen. 90274   18  $1,775    +15.7%   N/A      N/A      N/A  
Rancho P.V.       90275   21  $1,095     +0.7%     5     $450   -18.2%   
Redondo Beach     90277   11    $816    -34.2%     9     $790    +8.2%   
Redondo Beach     90278    9    $775     -1.5%    11     $763   +17.8%

Friday, April 18, 2008

March 2008 short sales in Redondo Beach

This is the list of recent short sales that my database is currently banging out. My prior list is here.

I measure strictly on a sale to sale basis, and do not take into account the costs of selling. Were I to do so, there would be more properties listed here.

SALE       PRIOR      % CHG   PROPERTY                   SQFT
           SALE

2008-04-07 2005-12-13 -16.0   103x    Avenue A            850
2008-03-17 2005-03-15  -6.0    20x    Camino Real B      2301
2008-03-17 2005-10-15 -15.0    62x    Esplanade 66       1361
2008-03-03 2005-12-09 -11.0   152x    Carver Street      1945
2008-02-26 2006-04-15 -32.0    44x    Calle Miramar 88   1868 *

The Calle Miramar transaction is flagged as abnormal by Zillow. It also went for more than asking price, which invalidates my claim that no recent transactions sold for more than asking price.

Wednesday, April 16, 2008

DQNews: Southland home sales log tepid gain; record price drop

Southern California home sales experienced a weak, listless "bounce" in March, according to this April 15 story by DQNews, but nothing worth trumpeting. 12,808 new and existing homes were sold, up +18.8% for the month but -41.4% YOY. The seasonal history has been that on the average, sales rise +38% between February and March. This has been the lowest February-March bounce since DataQuick started tallying it in 1988.

Foreclosure sales were nearly 38% of all homes sold. In February 2007 foreclosures were about 8% of homes sold. Los Angeles County had the fewest foreclosure in its mix of homes sold, at 28.8%, while Riverside County had the highest number of foreclosures, at 56.4%. DataQuick comments that buyers and would-be sellers are opting to sit tight until they sense that the market has bottomed, so foreclosures are driving the bulk of sales. Since they are increasingly influencing the market, foreclosures drag prices down probably another 5 to 10%, though in recent months it's been more like 15%.

The median price for sold homes in the Southland was $385,000, -5.6% from February, -23.8% YOY, and down from $505,000, a peak reached last spring and summer.

Clearly, there has been a shift in what sells. Jumbo loan financing accounted for 15% of sales in March. In March 2007 it was 40%.

Very few industry experts were quoted in the article. Nobody even wants to venture a guess as to whether the bong hits doled out by the government (changes to conforming loan limits, FHA options) will help resuscitate this market.

The median monthly mortgage payment committed to in March was $1,816, down from $1,821 in March, and down from $2,326 in March 2007. It is -28.3% from the peak in June 2006. Adjusted for inflation, the monthly mortgage payment is actually -12.6% from spring 1989.

Indicators of stress continue to point in different directions. Non-owner occupied housing activity remains up (are these wannabe flippers?), flipping rates are stable, ARM financing is at a six year loan, foreclosures remain pegged at highs.

County         # sold  # sold   % chg    med       med      % chg
                 2007    2008            Mar 07    Mar 08
Los Angeles     8,353   4,263   -49.0%  $540,000  $440,000  -18.5%
Orange          3,130   1,663   -46.9%  $629,000  $506,000  -19.6%
Riverside       3,680   2,691   -26.9%  $420,000  $306,250  -27.1%
San Bernardino  2,476   1,534   -38.0%  $369,000  $265,000  -28.2%
San Diego       3,218   2,108   -34.5%  $490,000  $395,000  -19.4%
Ventura           999     549   -45.0%  $566,750  $430,000  -24.1%
SoCal          21,856  12,808   -41.4%  $505,000  $385,000  -23.8%

Saturday, April 12, 2008

Recent price reduction history in Redondo Beach

I thought I would take a look at price reduction history on sold homes and see how it looks charted. There isn't much data to go by, but I thought the chart might tell us something anyway. So I've plotted both median and average price reduction percentages on sold homes.

Looking at the data this way, it makes sense to me that price reductions would be deeper during the slow parts of the year (around January) and lighter during the busier times of the year. The rises and dips remind me very much of the DOM charts that I post for the beach cities when I do my "Other measures of beach cities market activity" post toward the end of the month.

I see that average reduction was roughly the same for January 2007 and 2008, but median reduction was lower than the average in January 2007 and then pushed up past the average in January 2008. I would interpret that to mean that more sold homes have had price reductions compared to those the year before.

Thursday, April 10, 2008

Preliminary look at March 2008 Redondo Beach sales

I waited until I got the Manhattan Beach Reporter tonight so I could fold the home sales for the week of March 31 - April 6 into the March numbers. I now have 35 sale records to look at. I know that there were 32 sales recorded in Redondo Beach for March, according to Home Data, so I probably folded in a few April sales - oh well.

STAT     SEP 2007   OCT 2007  NOV  2007   DEC 2007   JAN 2008    FEB 2008    MAR 2008
records        68         44         37         26         25          25          35
MEDIAN   $857,000   $755,000   $832,500   $782,500   $795,000    $755,000    $789,000
AVERAGE  $935,506   $770,416   $933,956   $832,827   $932,117    $831,500    $961,714
MIN      $369,900   $369,900   $379,000   $486,500   $449,900    $520,000    $585,000
MAX    $2,400,000 $2,560,000 $2,500,000 $1,500,000 $2,130,000  $1,590,000  $2,100,000

For March 2007, I had 105 sale records according to my final SALE records, with a median saleprice at $755,000, an average at $813,253, a min of $370,000 and a max of $2,027,000. So strictly looking at median price YOY, it looks like it is up 4.5%, but I wonder if I am really comparing apples to apples, given how the composition of the market has changed.

Looking back over my notes, I see I was very busy in the March-April 2007 time frame and didn't do the calculations for March 2007 that I would normally do. But my trusty Excel workbook still has the data. Another calculation of March sales, which I did on SUPPLY records, shows 90 records with a median sale price of $749,000 (not far from my first calculation), plus a median square footage of 1691 and an average square footage of 1773. Now let's look at square footage on current sales.

Median square footage for March was at 1931. Square footage on homes sold has continued to inch up, probably because of the newer bubble construction. Comparing the median square footage of homes sold in March 2008 compared to March 2007, it is up over 14%. This is a good indication that in terms of price, we are comparing apples to oranges, unfortunately.

How long did it take the sold homes to sell?

I thought this was pretty wild. For a few months I have been calculating median DOM as slightly over 4 months. Now it has leaped up to 5 months (152 days), and the average has landed there too (151 days).

Remember, my "DOM" is a more honest DOM. Some sales took nearly a year, counting from when I first found the property listed.

And how much did home sellers have to reduce their original asking prices?

NO homes sold for MORE than their original asking prices. The median PCTRED was 6.4% and the average was 7.2%. These numbers have been edging down slightly the past few months. It could mean that relatively newer sellers are getting better about initial pricing. We've really got 2 different sets of sellers on the DOM chart, so I'm guessing maybe the sellers clustered around 60 days initially priced their homes better than those sellers clustered around 240 days. If looking for practical advice on selling a home, I'd rather say you may have a shot at selling it within about 60 days if you price it really well, but if you insist on top dollar, expect it to sit on the market six months to a year - than say you'll sell your home in a median 5 months.

So that is what I came up with - median price is slightly higher from my year-ago calculation, but median square footage on homes sold is up more substantially. We are not comparing apples to apples YOY. DOM leaped up to 5 months, remaining tail-heavy, while percent reductions on asking prices seem to be drifting down.

Sales look like they are perking up a little now, which should not be surprising since they were really scraping close to bottom in volume. We'll just have to see how far the government bailout fuels the spring selling season.

Tuesday, April 08, 2008

L.A. Business Journal: March home sales slow, median price drops

The Los Angeles Business Journal's monthly Home Data report is out early!

According to this story by Mitch Deacon in the April 7 edition of the Los Angeles Business Journal, the median price of a SFR is now down to a three-year low in March. Sales of Los Angeles SFRs, both new and existing, fell -52% in March YOY. The median price is -17% now down to $465,000, and -21% off the May and July 2007 peaks.

The conventional bullish line of thinking has been that the affluent areas will be immune to a downturn in housing prices, but Madison Hildebrand, a Coldwell Banker broker for Malibu, notes that even though prices are still rising on what is sold, sales are down. Lynn Borland, the president of Wilshire Realty, which specializes in Westside luxury condos and townhomes, getting maybe "one sale for every 100 visitors", whereas in a "balanced market", a sale could be made to perhaps five or six people for every 100 visitors. While luxury home buyers have the cash to buy, they are "sitting back waiting for additional price drops."

Steve Johnson of Metrostudy states that we are scraping along a bottom in terms of sales volume, and believes that "activity will probably stay flat through 2009." Johnson also notes that transactions are primarily taking place among people who are forced to enter or leave the market for imperative reasons such as divorce and job transfer.

Nobody interviewed offered an opinion on where or when prices would bottom. The story notes the recent actions by the government to bail out the market. Congress is close to giving state and local governments $10 billion in bond funds to refinance subprime mortgages. Fannie Mae and Freddie Mac are allowed to purchase home loans as high as $729,000. According to the story, these actions "should" boost the market, but nobody offered an opinion as to how much.

In other gauges of market health, the Journal reports that building permits for SFRs in Los Angeles County were -62% YOY in January, according to the California Building Industry Association. In the Econowatch column, the Journal notes that residential building permits for February (and I assume this means both SFRs and condos) for February is -7.2% YOY, so this gauge may show less deterioration now.

For the state of California, for February, there were 53,629 notices of default filings, auction filings, and bank repossessions, up +131% YOY. One out of every 242 homes in the state filed for foreclosure.

The California Association of Realtors tabulates an index score of unsold homes. This more than doubled in February to 21.1 from 10.6 in February 2007.

-------------------------- SFR ----------------------------------
COMMUNITY          ZIP    Mar     %YOY        Mar    %YOY
                          Sales   Change      Price   Change
L.A County              2,532       -52%    $465,000  -17% 
El Segundo       90245      3       -75%    $830,000   -7%
Hermosa Beach    90254     11       -54%  $1,449,000  +12%  
Manhattan Beach  90266     12       -74%  $1,858,000  +16%  
Redondo Beach    90277     10       -17%    $912,000  -22%
Redondo Beach    90278      7       -81%    $705,000  -11%

------------------------ CONDO ----------------------------------
COMMUNITY          ZIP    Mar     %YOY       Mar       %YOY
                          Sales   Change    Price     Change
L.A. County              1,538     -56%    $411,000    -9%
El Segundo       90245       7       0%    $529,000   -15%
Hermosa Beach    90254       3     -40%    $655,000   -24%
Manhattan Beach  90266       0     N/A         N/A     N/A 
Redondo Beach    90277       5     -69%    $700,000   +10%
Redondo Beach    90278      10     -76%    $590,000   -13%

The most expensive homes (SFRs) in March were in Beverly Hills 90210 (+10% YOY), Bel-Air 90077 (+62%), Windsor Square 90020 (+44%), Malibu 90265 (-12%), Manhattan Beach (+16%), Marina Del Rey 90292 (+8%), Pacific Palisades 90272 (+7%), West Hollywood 90069 (+11%), Hermosa Beach (+12%), and Brentwood (-13%).

The most expensive condos were in Santa Monica 90402 (+47%), 90403 (+1%), and 90404 (-2%), Pasadena 91105 (+5%), Redondo Beach 90277 (-10%), Marina del Rey 90292 (-8%), Westwood 90024 (+24%), Brentwood 90049 (-2%), Hermosa Beach (-24%), and Playa Vista (YOY N/A).

The areas with the greatest SFR price losses in March were Long Beach 90813 (-45%), La Puente (-41%), Northridge (-38%), Belmont Shore 90803 (-37%), West Adams (-37%), Palmdale 93550 (-37%), Paramount 90723 (-36%), Chatsworth 91311 (-36%), San Gabriel 91775 (-36%), and Inglewood 90303 (-36%).

The areas with the greatest condo price losses in March were Paramount 90723 (-39%), Panorama City 91402 (-39%), Santa Clarita 91350 (-39%), Long Beach 90804 (-37%), Hawthorne 90250 (-34%), North Hollywood 91601 (-34%), Glendale 91205 (-32%), Reseda 91335 (-31%), Palms 90034 (-31%), and Glendale 91206 (-30%).

The article notes that peripheral areas have been particularly hard hit, though middle income neighborhoods closer to urban cores are faring somewhat better. Keep in mind that these sales occurred on such low sales volume that they don't tell us enough about valuations.


Given that sales have almost no place to go but up, I believe that some fish will take the bait from the government stimulus package and go shopping for falling knives. It's probably too soon to predict if the bong hit from the government will provide any boost at all, and even if it does, how far it could go. If the bong hit isn't of sufficient magnitude, Metrostudy may be proven to be right, in terms of the market just limping along a sales volume bottom through 2009.

Friday, April 04, 2008

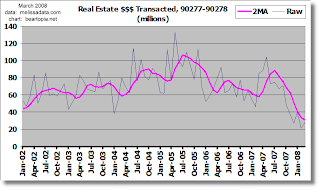
Los Angeles County South Bay Beach Cities Real Estate $$$ Transacted for March 2008

Believe it or not, the housing market is registering a pulse. I think housing sales are finally starting to pick up a bit, but in light of what has happened to the mortgage markets in recent months, I have no way to estimate how far a bounce will go. My client that works in mortgage at Wells Fargo is still busy and I fully take her word for it.

The FHA flyer that landed on my apartment doorstep the other day scared me. I call that FHA loan program "subprime + 5%", because for Redondo Beach prices they will probably want 5% down, but with few questions asked, such as, "Where is the money coming from?!?" If falling knife shoppers come flooding into this market, then we'll see more of the same problems a few years down the road when the FHA loans cave in. But then again, we'll see more problems even without these subprime + 5% loans, courtesy of our government and your tax dollars, so I'm really flying blind here. It's the market of the damned.

I find it somewhat ironic that at this point we really NEED a bounce, to get some of this unsold inventory with its history of price cuts finally sold off and marked to market. At least more sales will give us a better idea of where price levels really are, instead of leaving us just guessing.

For the most part, I'm seeing deep and frequent price cuts in unsold inventory, but a few sellers are still raising asking prices, anticipating a resurgence of the brisk housing market during the glory days of 2004-2006.

You can view a particular zip code through my regional tracker, and also my Google map tool.

YOY Comparisons

These numbers are a YOY comparison of the doubly smooth moving average of dollar volume charts. I think of them as "recent pain" (or recent gain) indicators.


Property sales and their realtors still on steroids...
90094           177.4% Playa Vista

Doing OK
90064             2.0% Rancho Park/Cheviot Hills
90501             1.7% Torrance

"I fell down down down in a burning ring of fire..."
90245            -7.3% El Segundo
90254           -12.4% Hermosa Beach
90293           -13.5% Playa del Rey
90045           -17.6% Westchester
90291           -17.8% Venice
90505           -22.1% Torrance
90034           -24.1% Palms
90292           -25.5% Marina del Rey
90401-90405     -27.2% Santa Monica combined
90056           -30.8% Ladera Heights
90504           -32.8% Torrance
90275           -35.5% Palos Verdes Estates
90501-90505     -35.9% Torrance Combined
90036           -36.7% Park La Brea
beach cities    -37.4% 4 Beach Cities combined
90066           -38.7% Mar Vista
90277           -41.2% Redondo Beach (south)
90266           -41.7% Manhattan Beach
SW county       -43.1% Southwest L.A. County
90717           -44.2% Lomita
90232           -45.3% Culver City
90732           -45.3% San Pedro/Rancho PV
90277-90278     -46.6% Redondo Beach combined
90016           -49.0% West Adams
90008           -49.0% Baldwin Hills / Leimart Park
90278           -50.3% Redondo Beach (north)
90035           -50.6% West Fairfax
90301           -52.8% Inglewood
90746           -55.3% Carson
90230           -56.0% Culver City
90019           -56.3% Country Club Park/Mid City
90007           -56.7% South Central
90043           -57.4% Hyde Park, Windsor Hills
90503           -61.5% Torrance
90250           -61.6% Hawthorne
90260           -61.6% Lawndale
90249           -62.5% Gardena
90247           -62.6% Gardena
90018           -62.7% Jefferson Park
90302           -63.7% Inglewood
90502           -63.7% Torrance
90062           -66.4% South Central
90745           -67.2% Carson
90044           -67.5% Athens
90047           -67.6% South Central
90731           -70.0% San Pedro
90301-90305     -70.9% Inglewood/Lennox combined
90304           -73.0% Lennox
90037           -76.0% South Central
90305           -82.4% Inglewood
90303           -82.9% Inglewood
90744          -142.3% Wilmington

Relative Strength

This is a longer-term view of the strength of dollar volume in a given zip code. For this month 5.3 is the strongest (suffering the least amount of chronic pain) and -1.0 being the weakest (suffering the most chronic pain). Think of it is as the area above 0 on the YOY graph with the area below 0 of the YOY graph subtracted out.

90094        5.3 Playa Vista
90247        3.1 Gardena
90305        2.7 Inglewood
90034        1.7 Palms
90044        1.7 Athens
90746        1.4 Carson
90292        1.4 Marina del Rey
90047        1.0 South Central
90062        0.9 South Central
90301-90305  0.9 Inglewood/Lennox combined
90304        0.9 Lennox
90007        0.9 South Central
90502        0.9 Torrance
90018        0.8 Jefferson Park
90016        0.7 West Adams
90301        0.7 Inglewood
90293        0.7 Playa del Rey
90745        0.7 Carson
90250        0.7 Hawthorne
90302        0.7 Inglewood
90501        0.7 Torrance
90303        0.7 Inglewood
90732        0.6 San Pedro/Rancho PV
90064        0.6 Rancho Park/Cheviot Hills
90043        0.6 Hyde Park, Windsor Hills
90037        0.5 South Central
90019        0.5 Country Club Park/Mid City
90008        0.5 Baldwin Hills / Leimart Park
90254        0.5 Hermosa Beach
90291        0.5 Venice
90045        0.4 Westchester
90230        0.4 Culver City
90503        0.4 Torrance
90249        0.4 Gardena
90036        0.4 Park La Brea
SW county    0.4 Southwest L.A. County
90260        0.3 Lawndale
90245        0.3 El Segundo
90501-90505  0.3 Torrance Combined
90232        0.3 Culver City
90278        0.3 Redondo Beach (north)
90066        0.3 Mar Vista
90731        0.3 San Pedro
90401-90405  0.2 Santa Monica combined
90505        0.2 Torrance
90277-90278  0.2 Redondo Beach combined
beach cities 0.2 4 Beach Cities combined
90056        0.1 Ladera Heights
90266        0.1 Manhattan Beach
90035        0.1 West Fairfax
90717        0.1 Lomita
90277        0.1 Redondo Beach (south)
90504        0.0 Torrance
90275       -0.1 Palos Verdes Estates
90744       -1.0 Wilmington

Dogmation