Wednesday, October 31, 2007

L.A. Times: Drop in Southland home prices outpaces the nation

It's nice to see the L.A. Times giving coverage to the Case-Shiller index. This October 31 story by Peter Hong restates what Macromarkets released yesterday.

Here is a brief YOY summary of the August report.


Charlotte           +5.6%
Chicago             -1.3%
Detroit             -9.3%
Las Vegas           -7.6%
Los Angeles/Orange  -5.7% 
Phoenix             -8.0%
San Diego           -8.3%
San Francisco       -4.2%
Seattle             +5.7%
Tampa, FL          -10.1%

Case-Shiller only looks at the values of existing SFRs, and excludes existing condos and new construction.

The August index for Los Angeles was 258.7, which is down from the September 2006 peak of 273.9.

L.A. Times: Motivated folks only

Realtors are starting to practice tough love, according to this October 28 article by Ann Brenoff.

Agent Walter Sanford is advising realtors to "dump the buyers" (i.e., the looky loos) and invest the time and money in obtaining listings of motivated sellers. To court looky loos with the housing market in the condition it is in will be inviting financial ruin, since buyers take longer to make decisions, they "nibble", and they drain your energy as you show them house after house after house and they still don't buy anything.

Some agents keep potential buyers on email lists that automatically send the buyers notices of new listings, price drops, and other changes (ZipRealty anybody?) One realtor says, "If they see something they like, they call me. [E-mail is] working just fine."

Agent Sanford wants to grill buyers with a 35-question form that asks questions like "Why haven't you bought yet?" Buyers must be pre-qualified (not just pre-approved by a mortgage broker) with a commitment by a lender. (Smart move - how many times have we heard stories about escrows failing because the buyer couldn't get a loan?) And then the buyer must commit to a loyalty agreement, to prevent the buyer from hopping from agent to agent.

But it's not all one-sided. Sellers are being told to wake up, though not put in those words. They just aren't going to be able to sell for what they think the home is worth, and if that isn't good enough, then they should defer their sale plans. Tough love. Sanford calls inflexible sellers "cement-heads."

By Sanford's estimates, 30% of experienced agents are turning down overpriced listings.

One realtor named Lonnie Maples described one listing he turned down. It would have cost him $100 a week to advertise the listing, plus have fliers printed, lock boxes installed, and mailings sent out. He said it is better to "catch" the listing on its second or third attempt, once some sense has been knocked into the seller and he is now facing reality (Maples didn't put it that way exactly...)

Other realtors agree to a listing for just a few days or weeks, only if the seller agrees beforehand to drop the price if the listing does not sell.

A Pacific Palisades realtor named Anthony Marguleas says he never walks away from listings, period. He feels it is the agent's job to educate the seller on the realities of the market and show him why his $1 million home won't sell for $2 million. "It's our job to not let him make a mistake." Marguleas calls agents who put buyers on the back burner just "plain lazy...it's actually more than lazy, it's insulting. Buying a home is the largest investment of someone's life, and an agent doesn't have the patience or time to show them homes anymore? That's not right."

Tuesday, October 30, 2007

Macromarkets: Los Angeles area median housing price down -5.7% YOY

The Case-Shiller index was released for August 2007.

According to the index, Los Angeles area median home price was down -5.7% from August 2006, and down -1.1% from July 2007.

To learn more about the Case-Shiller methodology, visit Macromarkets.

Sunday, October 28, 2007

L.A. Times: California home foreclosures again set a record - the trend is creeping into affluent communities

According to this October 27 article by Peter Y. Hong, California is setting new records in foreclosure activity. Statewide, default notices hit 72,751, beating a Q1 1996 record. Foreclosures hit 24,209, also setting a record.

Foreclosure "pain" is now starting to creep into pricier neighborhoods in Orange County and Los Angeles County and is invading affluent areas. One real estate agent said, "it's working its way to the Westside. The Westside is always the last to get hit." The lady who said that apparently remembered the 90's downturn. She also said that those foreclosing in the pricier areas were "people who kept pulling money out of their houses, using equity loans to pay credit cards, buy cars, go on trips. They used their homes to get cash and kept pulling equity out."

Dataquick still claims the problem is just "a smattering." A Dataquick analyst speculates that foreclosures in the pricier areas could be tied to "job loss, divorce, or other hardships."

Q3 2007 saw 13,314 foreclosures in the counties of Imperial, Los Angeles, Orange, Riverside, San Bernardino, San Diego, and Ventura. In Q3 the number of foreclosures was 1,960. Yes, you read that right, from 4 digits to 5 digits. Up almost 600%. Los Angeles had the highest number, at 3,627. The number of notices of default for Southern California reached 41,062.

In Orange County, about 10% of the for sale listings are foreclosures and short sales, which one analyst said is keeping inventories high as a time of year when inventories normally fall. "We can't come off those high inventories when we keep getting more bank-owned listings,", he said.

Here are further details from Dataquick. For the state, a total of 72,571 notices of default were filed in Q3. That's up 34.5% from Q2 and up 166.6% YOY.

About half the state's default activity is concentrated in 293 zip codes, largely in the Central Valley and the Inland Empire. These same areas saw prices surging through 2005, peaking in 2006, and now off their highs by about 11%. For 1,172 zip codes, prices peaked in Q2 2004 (earlier) and prices are now off their highs by about 2.5%.

Most loans defaulting in Q3 2007 were originated between July 2005 and September 2006. ARM financing for primary home purchases peakes at 77.8% in May 2005 and has fallen.

Since some properties are being financed with more than one loan, it was actually 68,746 residences that got notices of default.

The actual usage of home equity lines of credit is not available via public records. However, in the state, homeowners are a median 8 months behind in payments.

The zip codes with the worst foreclosure problems are 95330 (Lathrop), 92571 (Perris), and 95832 (Sacramento).

Of those in default, currently 45.9% manage to make their payments current, refinance, or sell the home and pay off what they owe. A year ago that figure was 80.9%. More homes are being lost due to foreclosure.

The peak of the last cycle had the actual number of homes lost to foreclosure at 15,418 in Q3 1996. The recent low was 637 in Q2 2005. Currently, the number is 24,209 in Q3 2007.

Thursday, October 25, 2007

CAR September 2007 report for Redondo Beach

The following figures are from the California Association of Realtors (CAR) for September.

The median price for a Redondo Beach home (new or existing, SFR or condo) is now $847,500, up 8.0% YOY. It's reassuring to see this number come pretty close to what I've been number-crunching as that gives me a bit more confidence in my data.

For the beach cities, which to the best of my knowledge encompasses what Shorewood encompasses - El Segundo, Manhattan Beach, Hermosa Beach, Redondo Beach - the median price is $970,000, up 6.6% YOY from September 2006.

For the South Bay area, the median price is $690,000, up 13.1% YOY.

Curiously, the Palos Verdes Peninsula area median price is $1,117,500, down -9.1% YOY. Now comes the fun part speculating as to why PV is showing a decline when everything else isn't. Theories, anybody? We know that mortgage financing problems have made the lower end markets inaccessible to many buyers, so sales are being skewed toward the higher end. Now if there is one place around here where there are nice high-end homes, it is PV. Why are the affluent buying the bloat in Manhattan Beach, but not going for the nice stuff in PV? Could it have to do with commuting time and fuel expenses?

I still haven't figured out why Excel refuses to plot the Moving Average series on the price trend graph below. Oh well.

For Los Angeles County, median price was $525,000, up 0.8% YOY.

Wednesday, October 24, 2007

Unresolved inventory stats in Redondo Beach

It's time to take another inventory snapshot of what I've got in my inventory database.

Rather than call it unsold inventory, I call it "unresolved" inventory, because some of these properties could well have been sold, but no sales record appears anywhere to clue me in. A few have also been rented out, and selling has been put on the back burner for the time being. So my data is not perfect in that regard. At the moment I have what I think are 870 good inventory records.

Of my unresolved inventory, 17.8% of it is new construction.

As far as changes to asking prices, 1.2% of inventory show price INCREASEs. Other price changes are summarized here:

INVENTORY  PCT CHANGE
50.1%      0-2.5%   reduction
16.8%      2.5-5%   reduction
 8.6%      5-7.5%   reduction
 5.3%      7.5-10%  reduction
 3.3%      10-12.5% reduction
 2.8%      12.5-15% reduction
 1.1%      15-17.5% reduction
 0.6%      17.5-20% reduction
 0.2%      20-22.5% reduction
 0.3%      22.5-25% reduction
 0.2%      27.5-30% reduction

Obviously if they aren't selling, these properties are staying on the market awhile. Median DOM is 163 and average DOM is 197.

So far I have NOT been able to plot a relationship between time on market and percentage price reduction. I wonder if that says anything about the uncertainty of price direction.

Square footage tends to run a shade higher on unsold properties than on sold properties. For this set, median sqft is 1831, average is 1929.

And now here's a rather interesting part. The gap between what sellers want and what buyers are willing to pay seems to have closed up. Here is what the sellers of this unresolved inventory want.

           ORIG ASK     CURRENT ASK
MEDIAN     $852,500     $838,950
AVERAGE  $1,001,165     $969,730
MIN        $369,700     $360,000
MAX      $4,999,000   $4,999,000

If you recall my prior post about September sales, I calculated a median sale price of $845,000 and an average of $948,814. These numbers are pretty close to the area of current asking price on unresolved inventory. In a post early this year, I did a "fantasy gap" calculation and showed the current asking price of February inventory at a median of $849,000, while February sales were at a median of $745,348. That was quite a gap, and it's closed.

If buyers and sellers are now in the same ballpark in terms of their perceptions on property valuations, what does this mean going forward? Will sale "viscosity" improve because of this convergence? Or does that mean that, like two billiard balls meeting and colliding, opinion is about to diverge again?

Unfortunately, what I am not showing here is the sales trend according to the square footage sold. From the numbers above, it appears that buyers have been the losers and have caved in to the asking prices of the sellers, when in fact we know that "lower end" properties have been undergoing price reductions and potential buyers are now out of the market since they cannot get mortgage loans.

To show long term trends (even since, say, 2004, by quarter) of properties at a particular square footage, I would need to fix my sale records with the proper square footage - which is a substantial project in itself. Too many of them contain the old square footage of a teardown, or don't reflect additional square footage from a remodel. Maybe when I have some time I can tackle this.

Tuesday, October 23, 2007

Other measures of Los Angeles beach cities market activity, September 2007

I have been putting off doing "final" calculations for September because the data, well to put it bluntly, stinks. It's incomplete. So I have to wing it based on sales reported in the local Easy Reader. To estimate final sale date, I subtract a week from the date of the Easy Reader publication in which the sale is listed.

Based on 57 sale records, here are my sales stats based on SUPPLY records. Note that the MIN PCTRED, which is negative, actually means that properties sold for MORE than their asking price. It happens on occasion.

          SALEPRICE  SQFT   PCTRED   DOM

MEDIAN     $845,000  1733     4.5%    94
AVERAGE    $948,814  1846     4.9%   125 
MIN        $369,900   410    -7.2%    10
MAX      $2,400,000  3839    20.2%   475

Here is my chart of DOM for September. I came up with a median DOM of 94 and an average DOM of 125 days. My calculations of time on market have been hanging in there at about 3 months for median and 4 months for average.

Shorewood has published September numbers.

According to the Shorewood numbers, DOM for the beach cities housing markets has edged up to 48, up from 42 in September 2006. As you can see, there is a huge gap between what I come up with and what they come up with for all the beach cities.

A real estate flyer landed on my doorstep yesterday from an agent at Re/Max. The flyer listed 10 properties sold in North Redondo Beach between September 16 and October 16, then calculated an average sale price for the 10 properties (a horrible use of statistics) and an average DOM of 42 days. It appeared this realtor was polishing her sale data to show the local market in the best possible light. I sincerely hope my results are more accurate. At least I have a larger sample size!

More data from Shorewood for the beach cities. Here is the September chart for Supply Strength (Demand Weakness). Inventory is starting to shoot up again relative to sales. In September 2006 inventory was at 751, in September 2007 it was at 613. In September 2006 there were 142 sales, in September 2007 there were 117 sales. My ratio was 4.29 in September 2006, and it is 4.24 in September 2007.

Median price for the beach cities for September was $950,000, up from $887,000 in September 2006.

I hope that CAR publishes the September 2007 median price report within the next week; then I can update CAR's Redondo Beach chart.

Los Angeles Beach Cities Resale Activity for September 2007

According to Dataquick, southland home sales were at their lowest level in September in more than 2 decades. Jumbo financing declined more than 50%.

The Southland sold 12,455 new and resale SFRs and condos in the 6 county region in September. The prior most recent low was February 1995, with the sale of 12,459. September sales were down 30% from August, and down 48.5% YOY.

The median Southland price for a home was $462,000, down 4.0% YOY and down 7.6% from August. Analysts figure that even if jumbo financing had remained stable, the median would have been around $487,000.

The monthly mortgage payment commitment that buyers took on was $2,198, down from August's $2,422, and down from $2,295 from September 2006. Foreclosure activity remains pinned at record levels, ARM financing is flat, multiple mortgage financing has plummeted, down payment sizes are stable, non-owner occupied activity and flip rates are flat, according to Dataquick.

Here are the All Home Sales figures for Southern California:

County          Sales     Sales    % Chg    Median $    Median $   % Chg
                Sep 06    Sep 07    YOY     Sep 06      Sep 07      YOY
Orange          2919      1643     -43.7%   $630,000    $570,000    -9.5% 
Los Angeles     8636      4361     -49.5%   $519,000    $525,000    +1.2%
Riverside       4730      2208     -53.3%   $421,000    $375,000   -10.8%  
San Bernardino  3437      1509     -56.1%   $365,000    $325,000   -11.0%
San Diego       3336      2152     -35.5%   $485,000    $470,000    -3.1%
Ventura         1137       582     -48.8%   $592,500    $545,500    -7.9%

Here in Los Angeles County, the RESALE median for SFRs was $565,000, +3.7% YOY. Resale median for condos was $425,000, +4.2%.

Here are the L.A. County and beach city zip code charts.

                          SFR   MEDIAN   %YOY    CONDO  MEDIAN   %YOY  
COMMUNITY         ZIP    SALES   SFR      CHG    SALES  CONDO    CHG
LA/Westchester    90045   23    $820     +2.6%     0     N/A       N/A  
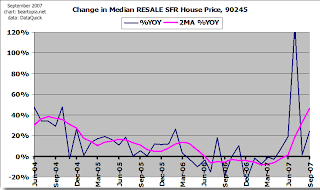
El Segundo        90245    6    $845    +24.3%     1     $540    +2.9% 
Hawthorne         90250   18    $485     -8.3%     3     $310   -26.0%  
Hermosa Beach     90254    7  $1,287    +25.0%     2     $661   -38.3%  
Lawndale          90260    5    $500     -8.7%     4     $361   -17.7%  
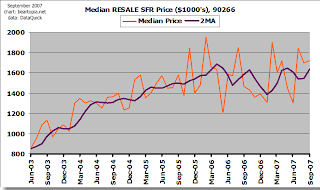
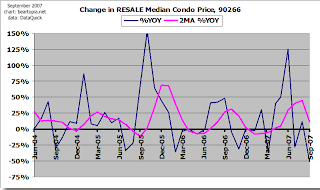
Manhattan Beach   90266   24  $1,720    +17.4%     1     $840   -50.6%  
Palos Verdes Pen. 90274   22  $1,373     -8.5%     7     $440   +26.8%  
Rancho P.V.       90275   21  $1,130     -2.0%     6     $643   +11.2%   
Redondo Beach     90277   16  $1,033    +17.0%    16     $809   +14.3%   
Redondo Beach     90278   20    $728     -5.3%     9     $773   +15.4%

Long time blog readers know that I take issue with the way these numbers are reported. With types of sales broken out into zip codes, the numbers end up being too small to truly get statistically significant trend information. The numbers for L.A. County and the Southland in general are the most meaningful. Los Angeles County still floats on layer of helium and hemp smoke, though median price momentum is slowing. What's going on in the beach cities is due more to the narrowing of activity in higher-end homes.

Friday, October 12, 2007

Preliminary look at September Redondo Beach home sales

How annoying that Zillow does not yet appear to have September home sales updated for Redondo Beach. Very well, then, I'll just have to make my calculations out of what I have found in the local beach city papers, keeping in mind that I occasionally see inconsistencies between what the papers report and what Zillow reports.

Here is my running tally of median, average, minimum, and maximum sale price, taken from my SALE records:

STAT     MAR 2007   APR 2007   MAY 2007   JUN 2007   JUL 2007   AUG 2007   SEP 2007      
records       105        114         91         62         78         51         68
MEDIAN   $755,000   $799,000   $777,000   $764,500   $860,000   $850,000   $857,000
AVERAGE  $813,252   $884,271   $855,228   $830,711   $880,279   $867,925   $935,506
MIN      $370,000   $470,000   $453,000   $485,000   $359,000   $365,000   $369,900  
MAX    $2,027,000 $1,750,000 $1,640,000 $1,565,000 $2,299,000 $1,510,000 $2,400,000

Here is a breakdown of sales by square feet:

And here's a breakdown of sales by price:

Notice that median price has remained elevated relative to June, before our Summer of Mortgage Fun started.

Monday, October 08, 2007

L.A. Business Journal: L.A. County Home Sales Fall by Nearly Half in September

This story by Howard Fine in the October 8-14 issue of the L.A. Business Journal concedes thatthe mortgage credit crunch continues to impact the market. The median price in L.A. County is $580,000, up 5% YOY, and $5K away from its high. Sales of high-end homes remain relatively brisk. However, sales of average and lower-end homes have plunged.

County sales of new and existing SFRs and condos was 3287, -46.6% from September 2006 and -21% from August.

The journal notes that in YOY comparisons, sometimes five weeks of data are compared to four weeks. (They're just now figuring this out!?!) So the sales numbers for August were exaggerated when compared to 2006 because of this problem.

75% of county zip codes experienced double digit percentage drops. For many zip codes the drops were at least 50%. Condominiums are holding up better than SFRs, because many condos can be bought with a conforming loan, below the $417,000 Fannie Mae limit.

One agent said, "Buyers are still waiting: they think the bottom might fall out. Sellers don't want to come down on their prices. It's a real standoff."

A lot of buyers can forget about getting financing for a starter home. But the high end of the market continues to experience almost insatiable demand. This market experienced only tiny hiccups in August, according to one observer. One agent at Westside Estate Agency says he's got 10 buyers that want to spend $20 million and the homes just aren't there. As the dollar has dropped, well-heeled foreign investors have descended on places such as Beverly Hills to snatch up what they can. (Where's the benefit of a lower dollar if you're still buying an inflated price?!?)

A broker in San Marino has seen some slowdown in sales, but some buyers who were thwarted by the credit crunch have since lined up financing, and some properties are getting multiple offers. This broker expects sales to improve in November and December because "new home loan products are coming onto the market...It will make it easier for some people to get loans, especially those who are qualified." (Uh-oh!)

-------------------------- SFR ----------------------------------
COMMUNITY          ZIP    Sept    %YOY        Sept    %YOY
                          Sales   Change      Price   Change
El Segundo       90245      9     +28.6%    $845,000   -0.6%
Hermosa Beach    90254     16      +6.7%  $1,375,000  +17.5%  
Manhattan Beach  90266     36     -16.3%  $1,704,000  +14.4%  
Redondo Beach    90277     16      +6.7%    $998,000  +15.2%
Redondo Beach    90278     25     -16.7%    $740,000   +0.6%

------------------------ CONDO ----------------------------------
COMMUNITY          ZIP    Sept    %YOY        Sept    %YOY
                          Sales   Change      Price   Change
El Segundo       90245       2    -66.7%    $686,000  +29.9%
Hermosa Beach    90254       2    -50.0%    $660,000  -22.5%
Manhattan Beach  90266       0     N/A        N/A      N/A   $650K in 2006
Redondo Beach    90277      16   +100.0%    $886,000  +31.5%
Redondo Beach    90278      22     +15.8%   $807,000   +6.9%

(Isn't it amazing how these statistics obscure how low-end inventory is mounting up in places like Redondo?)

The article does not break out SFRs from condos in the following price statistics. The most expensive homes in Los Angeles County are in Bel-Air 90077 (+104.9% YOY); West Hollywood 90069 (+83.3%); Beverly Hills 90210 (+8.2%); Pasadena 91105 (+158.9%); Manhattan Beach 90266 (+14.4%); Malibu 90265 (+2.6%); San Marino 91108 (+21.6%); Palos Verdes Estates 90274 (+9.5%); Pacific Palisades 90272 (-18.8%).

The zip codes with the biggest price losses are in Long Beach 90802 (-44.5%); South Los Angeles 90248 (-34.3%); Topanga 90290 (-31.9%); West Hollywood 90038 (-28.2%); North Hollywood 91601 (-28.2%); Westlake Village 91362 (-27.1%); Inglewood 90303 (-26.8%); Long Beach 90806 (-26.4%); Castaic 91384 (-23.5%); and Watts 90002 (-22.7%).

Friday, October 05, 2007

Los Angeles County South Bay Beach Cities Real Estate $$$ Transacted for September 2007

There's no question about it - dollar volume in many zip codes is plummeting. Even hot areas like 90064 (Rancho Park), are seeing hairpin turns in dollar volume, though the YOY graph, which is derived from a moving average of dollar volume, does not reflect that change yet. It continues to amaze me how how Los Angeles County real estate continues to levitate on a layer of helium and hemp smoke (high-end luxury homes).

Before I forget to tell you, I expanded my Southwest Los Angeles County coverage to include zip codes 90247 (Gardena), 90274 (PV), and 90710 (Harbor City). These areas have had extremely volatile and wacky graphs. When folded in with the Southwest Los Angeles County charts, though, the volume of data smooths things over a bit. I think most people visiting here understand the limitations of the data I get.

Beach city sales volume was comparable to last year (144 in 2007 versus 148 in 2006). Dollar volume was $172 million versus $163 million.

Redondo Beach sales volume was up (79 in 2007 versus 72 in 2006). Dollar volume was $71 million versus $57 million.

Looking at the sales volume charts for the beach cities and Redondo Beach, notice that sales volume peaked in the spring of 2002 (again, my data is limited, and only goes to the beginning of 2002). This area has been relying on price gains for many many years to offset the decline in volume and keep the gravy train rolling. It must not be easy being your average realtor right now, when just a few short years ago price gains of 20% and more were the expectation.

Inventory, at least Redondo Beach inventory, has been hitting the market at a pretty good clip. For the first few days of October, new inventory was greater than 4 properties a day. To me, inventory is increasingly looking like that irritating pebble in the boot. But I'll save that for another post.

For details on individual zip codes, visit the regional tracker, along with our Google map tool of the same data.

YOY Comparisons

Compares a moving average of $$$ volume to the prior year - a measure of Acute Pain.

Realtors fat and happy
90094           62.0% Playa Vista 
90064           59.5% Rancho Park/Cheviot Hills 
90254           52.4% Hermosa Beach 
90293           46.7% Playa del Rey 
90291           24.7% Venice 
90277           24.0% Redondo Beach (south)

Doing well
90277-90278     10.0% Redondo Beach combined 
90732            9.9% San Pedro/Rancho PV 

Hanging in there...
90278            0.6% Redondo Beach (north)
beach cities     0.4% 4 Beach Cities combined 

Losing a grip...
90275           -0.7% Palos Verdes Estates 
90292           -1.1% Marina del Rey 
90036           -1.4% Park La Brea 
90503           -1.5% Torrance 
90505           -6.4% Torrance 
90008           -8.4% Baldwin Hills / Leimart Park 
90066           -9.4% Mar Vista 

Slip sliding away...
90034          -13.0% Palms 
90266          -14.8% Manhattan Beach 
90401-90405    -16.0% Santa Monica combined 
90045          -16.1% Westchester 
SW county      -17.4% Southwest L.A. County 
90035          -20.0% West Fairfax 
90019          -20.6% Country Club Park/Mid City 
90232          -24.3% Culver City 
90230          -25.1% Culver City 
90250          -25.3% Hawthorne 
90501-90505    -29.4% Torrance Combined 

Sliding over a cliff...
90717          -30.1% Lomita 
90007          -34.1% South Central 
90504          -39.8% Torrance 
90016          -40.1% West Adams 
90047          -41.1% South Central 
90044          -41.5% Athens 
90245          -42.2% El Segundo 
90745          -42.4% Carson 
90056          -42.9% Ladera Heights 
90249          -43.1% Gardena 
90501          -43.3% Torrance 
90304          -47.2% Lennox 
90018          -48.9% Jefferson Park 
90260          -49.0% Lawndale 
90303          -50.0% Inglewood 

Off the cliff...
90302          -50.7% Inglewood 
90746          -54.6% Carson 
90043          -55.0% Hyde Park, Windsor Hills 
90062          -56.1% South Central 
90037          -59.3% South Central 
90301          -60.1% Inglewood 
90301-90305    -62.9% Inglewood/Lennox combined 
90502          -66.3% Torrance 
90305          -78.2% Inglewood 
90744          -98.7% Wilmington

"Relative Strength"

A longer-term view of the strength of dollar volume, with 4.5 being the strongest (suffering the least amount of chronic pain) and 0.1 being the weakest (suffering the most chronic pain).

90094        4.5 Playa Vista
90305        3.2 Inglewood
90044        2.1 Athens
90034        1.9 Palms
90746        1.8 Carson
90292        1.6 Marina del Rey
90047        1.4 South Central
90301-90305  1.3 Inglewood/Lennox combined
90062        1.3 South Central
90502        1.3 Torrance
90304        1.2 Lennox
90018        1.2 Jefferson Park
90007        1.1 South Central
90303        1.1 Inglewood
90745        1.1 Carson
90302        1.1 Inglewood
90016        1.1 West Adams
90301        1.1 Inglewood
90250        1.0 Hawthorne
90037        1.0 South Central
90043        0.9 Hyde Park, Windsor Hills
90732        0.8 San Pedro/Rancho PV
90249        0.8 Gardena
90019        0.8 Country Club Park/Mid City
90501        0.8 Torrance
90260        0.7 Lawndale
90293        0.7 Playa del Rey
90230        0.7 Culver City
90503        0.7 Torrance
90008        0.6 Baldwin Hills / Leimart Park
SW county    0.5 Southwest L.A. County
90501-90505  0.5 Torrance Combined
90291        0.5 Venice
90036        0.5 Park La Brea
90064        0.5 Rancho Park/Cheviot Hills
90245        0.5 El Segundo
90232        0.5 Culver City
90045        0.5 Westchester
90278        0.5 Redondo Beach (north)
90254        0.5 Hermosa Beach
90066        0.4 Mar Vista
90056        0.4 Ladera Heights
90035        0.4 West Fairfax
90744        0.4 Wilmington
90717        0.3 Lomita
90277-90278  0.3 Redondo Beach combined
90401-90405  0.3 Santa Monica combined
90505        0.3 Torrance
beach cities 0.3 4 Beach Cities combined
90504        0.3 Torrance
90266        0.3 Manhattan Beach
90277        0.2 Redondo Beach (south)
90275        0.1 Palos Verdes Estates

Dogmation