Friday, May 19, 2006

DQNews South Bay Resale Activity for April 2006

According to DQ News, the April Monthly resale activity for the south bay area showed the following:

Zip     # SFR   Median   %Chg   # Condo  Median    %Chg 
        Sales   $SFR      YOY    Sales   $Condo     YOY
90045    30     762,000   3.3      1     305,000  -29.4
90245    13     825,000  -2.4      5     550,000   11.6      
90254    13   1,149,000  31.3     18     993,000   49.4   
90260    16     524,000  11.8      2     499,000   48.8       
90266    30   1,635,000  17.6      3   1,355,000    0.4
90277     9   1,349,000  48.2     17     706,000   23.3     
90278    18     770,000   4.1     32     729,000    1.8

I tried taking the %YOY change in a doubly smooth 3 month moving average of the median SFR prices of each of the beach cities to see if anything interesting shows up. The general drift of %YOY change is down, meaning that upward price momentum is slowing down, but there are no obvious median price declines. Since these are sales of existing SFRs, I don't think the resiliency of prices here can be blamed on the upward bias of new construction. The bubble is still holding up, at least through April 2006.

Note: the charts have a slight inaccuracy because I do not have available the median price data 3 months prior to June 2003 for calculating moving averages.

Tuesday, May 16, 2006

Current news stories

There are a few news stories in the May 16 Los Angeles Times that might be of interest to South Bay bubble watchers.

First, homebuilder confidence has fallen to an eleven year low, according to the National Association of Homebuilders (NAHB). Even so, the national median price for a resold single family residence has risen to $217,900 from $197,600, an increase of 10%. That is the lowest increase in a year. The number of sales of existing SFRs and condos fell by 1.5% quarter-by-quarter. NAHB anticipates new home sales to fall by 12% this year.

In another story, the growth in median home prices continues to slow. In the six-county region of Ventura, Riverside, San Bernadino, Los Angeles, Orange, and San Diego, the April median home price was $486,000, flat from March, and up 9% YOY. April 2006 sales were down over 21% YOY, making it the fifth straight month of YOY sales declines. In Los Angeles county, the median is $508,000, up over 13% YOY.

Tuesday, May 09, 2006

Realtor current market reports, early May 2006

Realtor Don Tambini is one of my favorite realtors to report from because he's a "numbers" kind of guy.

For the numbers below, just multiply out the number sold by the average price to get an idea of amount transacted, which is a more accurate indicator of market health than just the average price.

For Manhattan Beach SFRs in April, he reports the following numbers:

                         2006          2005
number sold:               31            39
average price:     $2,055,000    $1,568,000
average DOM:               72            24

For Hermosa Beach SFRs in April:

                         2006          2005
number sold:               15            16
average price:     $1,394,000    $1,039,000
average DOM:               58            36

For Redondo Beach SFRs in April:

                         2006          2005
number sold:               20            29
average price:       $965,000      $850,000
average DOM:               75            28

Unfortunately he does not report on El Segundo.

Following up on some properties we've tracked here

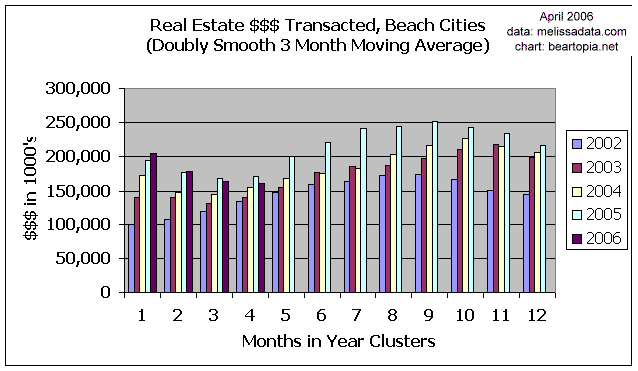
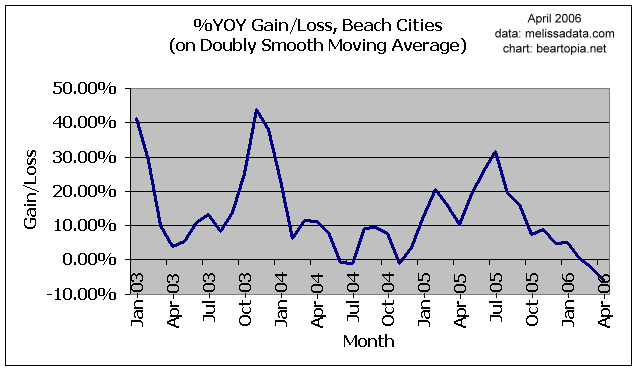
A quick glance at sales numbers for the beach cities, so far for May, show Hermosa Beach (90254), south Redondo Beach (90277), and north Redondo (90278) apparently resuming their slump over last year's numbers, while Manhattan Beach (90266) and El Segundo (90245) appear to be hanging on, but not exactly powering above the number of sales last year either. We'll continue to watch and see if that late winter/early spring bounce is over.

I thought I would track down some homes I had mentioned earlier this year that were for sale, and see what has happened to them.
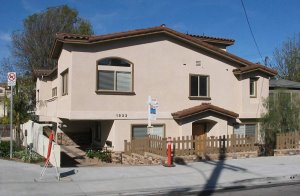
2002 Noslen Lane

I was mistaken about the front unit being for sale, it was actually the rear unit. It was listed for $999,900 and sold in February 2006 for $990,000. Zillow estimates its current worth at about $1,102,634, within the range $959,292 - $1,201,871.


2102 Swehtam

Don't let ZipRealty fool you. The listing date for this property is currently 4/24/2006, but in reality it's been for sale at least since New Year's. Last winter the sales brochure said "only $995,900", and now according to Zip Realty it's being offered at - whoa! - $889,000!! That's a better than 10% markdown! The real days on market is probably 120 and counting.


3191 Setag

As far as I can tell, this house did not sell.

The asking price was $1,198,000.


0212 Ruofud #19 and #20

#19 finally sold in March for $579,000. I don't think #20 was so lucky, even after getting listed with a second realtor at $570,000. I think the owners are now trying to rent out the unit. #2 in that same complex is now also for sale, at $589,000. Didn't the #2 realtor take note of what's happened with #19 and #20?!?

5122 Ruofud

This one is a mystery. A little old post-war box house, originally listed October 2005, I believe, at $950,000, then reduced to $900,000. It appeared the listing expired and there was no SOLD sign hung out in front. However it is now being torn down for condos. Was this some kind of private sale - a foreclosure - what?!? This is what makes following up on these properties so difficult - inconsistent data available through the regular channels.

0025 Nosnibor

This craftsman style home has been on the market at least since October 26, 2005 and was originally listed at $1,290,000. It has been relisted a few times, the last date being 4/18/2006, with the current asking price $1,225,000. Big deal.

3391 Swehtam

Unit B was advertised in February for $889,000. After a relisting (with price reduction), the asking price is now $849,900. The Zillow data looks like it got messed up somehow, as I had better data on this complex in February, but now it looks like the data in Zillow describes the old house previously standing there prior to these new condos.

These are just a few of the properties I've been observing, and as you can see it's a mixed bag. Some listings sell, some expire with no sale, and some relist at lower prices. Right now I am seeing a few "In Escrow" signs hung up around the neighborhood, so some homeowners are succeeding in selling their homes and hopefully getting out of the bubble.

Saturday, May 06, 2006

Update on DOM Market Conditions, April 2006

Realtor Don Tambini reports that the market has been slowing down in Redondo Beach. In April SFRs were on the market an average of 75 days compared to 28 days in April 2005.

Manhattan Beach SFRs in April were on the market an average of 72 days, compared to 24 days in April 2005.

Hermosa Beach SFRs in April were on the market an average of 58 days, compared to 36 days in April 2005.

Use the links on the sidebar to find out more details about current market conditions according to local realtors.

I wish the Easy Reader would publish graphs more like that shown below, which gives an alternate view of market conditions. (Fat chance of that happening - they probably get a lot of advertiser $$$ from local realties.)

I scraped the data out of the realtor market reports for the year:

Friday, May 05, 2006

Easy Reader First Quarter 05-06 Average Sales

When on the verge of change in trend, unfortunately the mechanisms that report data are geared to show that data in the best light possible and that has the effect of keeping the deception going that the bullish trend is still in place. The Easy Reader published the chart above in the May 4, 2006 print edition. The paper insists on publishing a chart of average sales price, which I hope by now bubble blog readers know is a sham.

Take, for example, the lighter blue bars (between the green and the red bars), which represent 90278 in 2005 versus 2006. January, February, and March all report higher average sales price in 90278. However, our chart of total real estate $$$ transacted for 90278 in Q1 shows a clear slump.

If you read the microscopic 2 point font fine print on the Easy Reader chart, it says something like oh yeah, by the way, homes are taking longer to sell.

Wednesday, May 03, 2006

Graph of Southland Home Prices Since 1989

This is an LA Times graphic of the median sales price of a home in the southland since 1989. Unfortunately the graph only goes through 2003. The median price has since climbed to about $500K, which would put the red line - oh, about at the thick light gray bar at the top, above the words "Southland home prices since 1989".

Such a line looks a lot like Nasdaq in 2000, doesn't it.

You can view the original LA Times graphic here.

California Foreclosure Activity Up - DataQuick

In a May 2 story, DataQuick Real Estate Information systems reports that foreclosure activity in the golden state has hit a two-year high during Q1.

The number of default notices sent out to homeowners is up 28.7% from Q1 2005, and up 23.$% from Q4 2005.

The drop in price gain momentum is one factor DataQuick states is a factor, since homeowners are now having a more difficult time selling their homes and paying off their lender. The amount of equity in a home and the type of loan used in the mortgage are other factors.

The median default amount on a primary mortage was $9,220 on a $280,000 loan. The Bay area is where loans are most likely to go into default, and the Central Valley and Inland Empire are the areas where loans are least likely to go into default.

Currently, only about 5% of homeowners in default end up losing their homes in foreclosure.

Monday, May 01, 2006

Real Estate $$$ Transacted through April 2006 for Beach Cities

Be sure to follow up by visiting the tracker link at the end of this post!

Realtors must be breathing a sigh of relief. The business that looked like it was slipping away during Q1 has bounced a little, even if only temporarily. One third of 2006 is now past us, and overall, the south bay beach cities are still a bubble that have not yet encountered the pin that is popping other areas. Other parts of the nation and even other parts of California are busy popping their bubbles, and we've barely gotten started. This area is not showing glaringly obvious price declines yet, but the pin will sooner or later show up here. Overall, there is an ever-so-slight slump in the market, but nothing crumbling or falling apart at the seams. By "slump" we mean - a loss of price gain momentum, not necessarily visible price declines.

El Segundo (90245) is waaaaay too up-and-down to name a trend either way.

Manhattan Beach (90266) and South Redondo (90277) are (finally!) taking a breather. We will know later this year whether it only temporary.

Hermosa (90254) has rebounded so far that total $$$ transacted for April exceeds April 2005 by 105%. North Redondo (90278) has rebounded for April and exceeds April 2005 by about 40%.

What about some of the surrounding areas? If anything, a few of these areas are possibly benefitting from the affordability issue in the beach cities. However, most areas are showing signs of a similar slump.

Overall, Torrance is doing OK. 90501 (around the old downtown) has had a respectable four months, but 90502 (the Torrance Harbor-UCLA medical center area) has been taking flight as if the real estate frenzy has relocated there. 90503 had a weak Q1 but rebounded a bit in April. 90504 (north Torrance) seems to be in a mild slump this year, and 90505 (west/southwest) seems to be having a rocky year.

How about north?

90094, Playa Vista, is not even analyzable, as it has been undergoing such incredible explosive growth. The charts show that - although the frenzy has cooled off a bit. Playa Vista makes the gains of the beach cities in recent years look almost sickly by comparison. 90293, Playa del Rey, on the other hand, has had that telltale Q1 slump and did not even rebound in April. Playa Vista is probably sucking away any buyers. 90292, Marina del Rey prices are still moving like a freight train, oblivious to any early bubble popping in the surrounding areas.

The momentum in Culver City (90230 and 90232) is headed downwards. 90066, Mar Vista, like Playa Vista, has been in a Q1 slump that it didn't bounce out of in April. 90035, Palms, had a weird spike in July 2003 that makes the data difficult to put on a chart, but overall, it, too, has been in a slump this year. 90291, Venice, looked like it was hanging on early this year but has recently fallen into a slump. 90064, Rancho Park, too, is feeling a newish slump. Rancho Park's price momentum is the lowest it's been in over three years.

So what can we conclude? Looking at one zip code, e.g., 90278, it would be easy to conclude that it has shaken itself out of the doldrums, but a look at the comprehensive beach cities data plus the data from surrounding areas shows that the slump is not just a single zip code issue - it is showing up in many places. The bubble remains intact, but could be starting to deflate. We will see if the April bounce has legs. In the meantime we will continue to watch, wait, and seek out additional sources of (free and easily accessible) data that will help us monitor a trend change.

Be sure to visit our south bay housing tracker for the details on these charts and for specifics on any particular zip code.

Dogmation