Thursday, March 30, 2006

Update on Current Market Conditions, March 2006

Goodness, I have not even had time to catch my breath since coming back from Colorado. By the way, the pace out there of everything is much slower than here, which is kind of nice, actually. Beautiful state, Colorado. Unlike the northeast or east, where the snow can sock you in for days and just weigh down everything so heavily, the snow can fall one day in Colorado and be gone the next, thanks to the dry air.

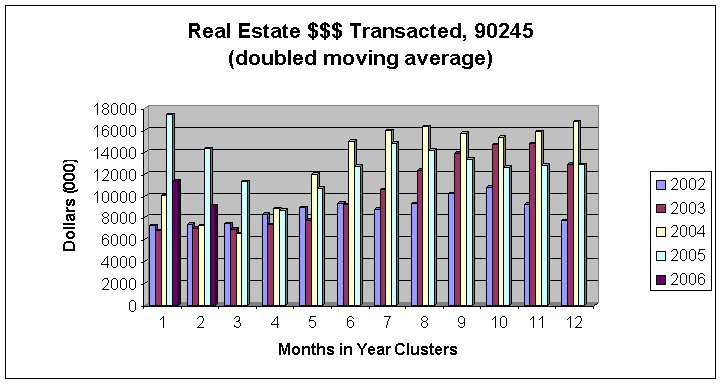
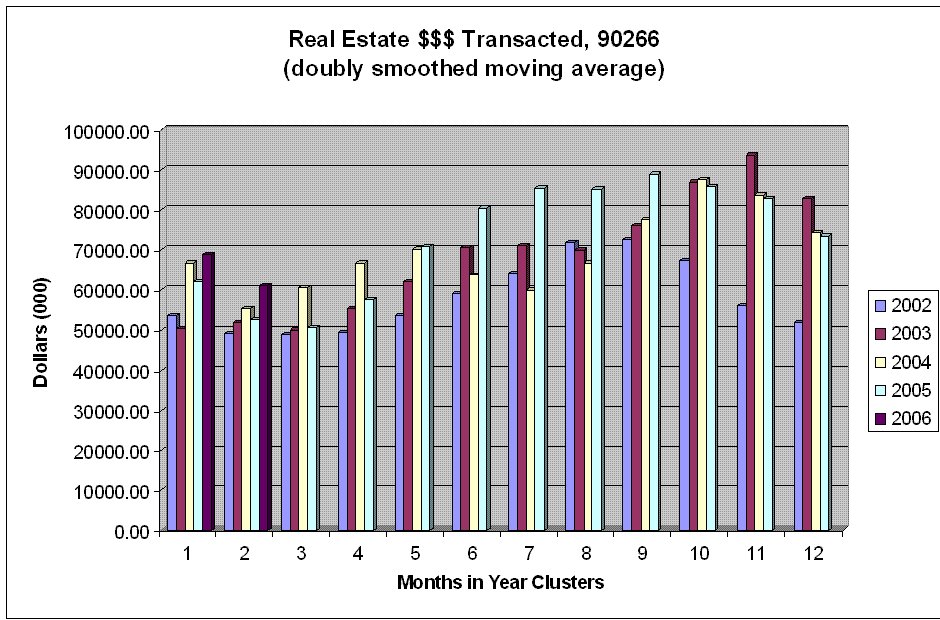
Fortunately I have a three day weekend coming so MAYBE I will get a little time to catch up here. Next week I will update my doubly smoothed moving average graphs with March sales data.

The last time we checked, 90278 (north Redondo) and 90254 (Hermosa) were showing signs of a housing slowdown. Let's see what the most recent data tells us, and let's see if the realtors are corroborating this, or denying this, or reluctantly acknowledging this, or whatever.

According to DQ News, the February Monthly resale activity showed the following:

Zip     # SFR   Median   %Chg   # Condo  Median    %Chg 
        Sales   $SFR      YOY    Sales   $Condo     YOY
90045    21     769,000   8.6      4     407,000    n/a
90245     4     920,000  26.5      6     465,000   10.3      
90254     4     970,000  -2.1      4   1,120,000   39.1   
90260     8     580,000  27.8      5     370,000   17.5       
90266    22   1,950,000  23.8      3     850,000  -35.7
90277    10   1,000,000  23.5      9     600,000   -6.1     
90278    17     731,000   2.0     16     655,000    6.4

One month does not a trend make, and small numbers skew trends further. But are we starting to see cracks in the condo market? Also, my zip of 90278 has been showing the clearest, most persistent weakness.

On 3/16, Maddy Cespedes ranked both the Current Market and Current Price Trend 3 out of 5. She reports, without commenting on comparisons year over year:

Homes that are well-situated, priced correctly and marketed properly are selling quickly (an average of 30 days). There has been 48 residential sales in the month of February 2006, 31 in North Redondo and 17 in South Redondo. Condominium prices started at $ 470,000. The highest price paid for a single family residence was $1,280,000 in South Redondo. Properties had been in the market for an average of 74 days.
On 3/20, realtor Robert Kissig ranks both the Current Market and the Current Price trend 5 out of 5, which really does not match his report:
Buyers are much more selective and looking for only the best properties. Its becoming a buyer's market... A sharp drop in home prices is not expected...The forecast remains strong.

If it is a buyer's market, I would have expected him to have ranked Current Market at 1, 2, or 3.

Don Tambini ranks both the Current Market and Current Price Trend 3 out of 5. He gives the following SFR sales data for February for all Redondo Beach:

      # SFRs sold    avg $$$     DOM     Real Estate $$$ Transacted
2006       16        866,000      76           13,856,000
2005       23        837,000      42           19,251,000

Mr. Tambini did not provide that last column - I did. But you can see he has given us the proper data to get real estate $$$ transacted for SFR when compared YOY. With number of transactions down, DOM rising, and fewer $$$ transacted, realtors must be starting to feel like they are scrambling for a smaller share of this pie.

Stay tuned...

Thursday, March 16, 2006

Blog vacation

This blog will be in Colorado until the 25th. Whatever you do, if you are watching the Southern California housing market and you are a fan of spaghetti westerns, do not click here.

Tuesday, March 14, 2006

Shorewood - South Bay home sales hit 12 month low in January

According to the February 27 news release by Shorewood Realtors, home sales hit a 12 month low in January, not rebounding after the traditionally slow holiday season. The report covers the cities of El Segundo, Manhattan Beach, Hermosa Beach and Redondo Beach (north and south).

Days on market is now at 47 days, compared with 38 January 2005. The number of homes listed jumped 67%. In neighboring cities Torrance and Inglewood, inventories did a triple digit jump.

However, asking prices were still up, with median selling prices up 31% YOY.

Shorewood says the pace picked up in February and March and says the "fundamentals remain in place" for "healthy price appreciation". The higher inventory "will be absorbed" because "demand remains strong".

OK, we'll check back with Shorewood in a year and see how things went for the year.

Saturday, March 11, 2006

Data sham continues, February 2006

Unfortunately, the Easy Reader does not publish this chart online, otherwise I would link to it.

The chart uses the exact same numbers from Melissa Data that I used for February 2006 stats, publishing average home prices YOY. The difference is that I multiplied the average sale price by the number of homes sold to get a sense of total real estate activity in $$$ for the month.

Real Estate $$$ Transacted through February 2006, 90245

Unfortunately El Segundo numbers are the choppiest yet. It is a tiny town so the impact of any one large construction project is going to skew data, and these numbers could be meaningless. The raw numbers show a downtrend for much of 2005 and uptrend for January and February, when considered YOY. The doubly smoothed average (above) shows the downtrend persisting into 2006.

Friday, March 10, 2006

Real Estate $$$ Transacted through February 2006, 90254

Hermosa Beach data is quite choppy, even with the double smoothing, but there is nevertheless some visible weakness starting to show up in 2006. $$$ for January 2006 dipped below those for January 2005 and even 2004; February 2006 $$$ are below those for everything back to 2002.

Real Estate $$$ Transacted through February 2006, 90277

So far South Redondo looks nearly as invincible as Manhattan Beach, unlike its weaker northern half. Same deal here - Melissa Data is used, numbers start from January 2002, a moving average is taken and smoothed again.

Real Estate $$$ transacted, through February 2006, 90266

While I may be able to make a case that 90278 is showing a decline, in terms of real estate $$$ transacted, the same cannot be said for Manhattan Beach, which still appears to be going warp speed ahead.

I did the same thing here as I did for 90278, that is, starting from January 2002, multiply the number of sales for the month by the average home price sold. The original data is extremely lumpy, with relatively huge numbers of sales (and $$$ transacted) Jul 2002, Apr 2003, Sep 2003, Mar 2004, Aug 2004, and Jul 2005, when compared to the other months. Even after doubling smoothing it with moving averages, I still did not completely delumpify it.

No sign of a slowdown yet in 90266.

Thursday, March 09, 2006

Real Estate $$$ Transacted, 90278, through February 2006

The image above uses numbers taken from Melissa Data (links in the Links section of this page). I took sales data for 90278 from 2002 and for each month multiplied the number of sales by the average sold home price. The resulting data is dollars transacted in thousands of dollars. The results were a bit choppy because sometimes certain months had a huge lump of sales. So I applied a moving average to the monthly data and came up with a smoother graph.

Months 1 and 2 (January and February) show data for 2002-2006; the remaining months show data for 2002-2005. As you can see, for just about any given month, the real estate dollars transacted has climbed steadily YOY. There is a barely noticable dent in May 2004, but the first real sign that dollars transacted has declined is December 2005. Thereafter, January 2006 shows a very clear dip in dollars transacted, and February 2006 was not only lower than 2005 but even 2004. (The original data, without the moving average, also confirms this.)

The slump is here.

P.S. Sorry I've been quiet lately - I had to get my taxes ready for the accountant and I am preparing for a trip to Colorado.

Dogmation